Ethereum (ETH/USD) continued its movements above the 200.00 figure during today’s North American session as the pair moved back to the 204.99 level after buying pressure emerged around the 201.33 area during yesterday’s European session. Some bearishness returned to the market today after traders could not sustain a move to the 212.17 level, just above the 211.34 area that represents the 50% retracement of the depreciation from 227.50 to 195.17. Short-term price support became evident when ETH/USD bids emerged around the 201.33 level during today’s European session, just below the 201.66 level that represents the 61.8% retracement of the recent appreciation from 195.17 to 212.17. Another technical clue emerged during today’s North American session when traders ran out of upside momentum around the 206.19 level, just below the 206.29 area that represents a downside price objective related to selling pressure that emerged around the 253.01 area in early March.
The technical resistance that the pair is encountering around this level is bearish in the short-term, and continues to evidence the very technical nature of the pair’s recent movements. Stops were elected last week around multiple important technical levels, including the 213.05, 206.29, 199.16, and 198.09 levels. Above current price activity, traders will pay very close attention to the 232.88 and 242.09 areas, additional upside price objectives related to the 90.00 level, with Stops likely to be decent above the 232.88 area. When ETH/USD comes off, traders will pay close attention to levels including the 187.79, 178.42, and 166.82 levels. Chartists are observing that the 50-bar MA (4-hourly) bullishly continues to indicate above the 100-bar MA (4-hourly) and 200-bar MA (4-hourly). Also, the 50-bar MA (hourly) bearishly crossed below the 200-bar MA (hourly), and continues to indicate below the 100-bar MA (hourly).
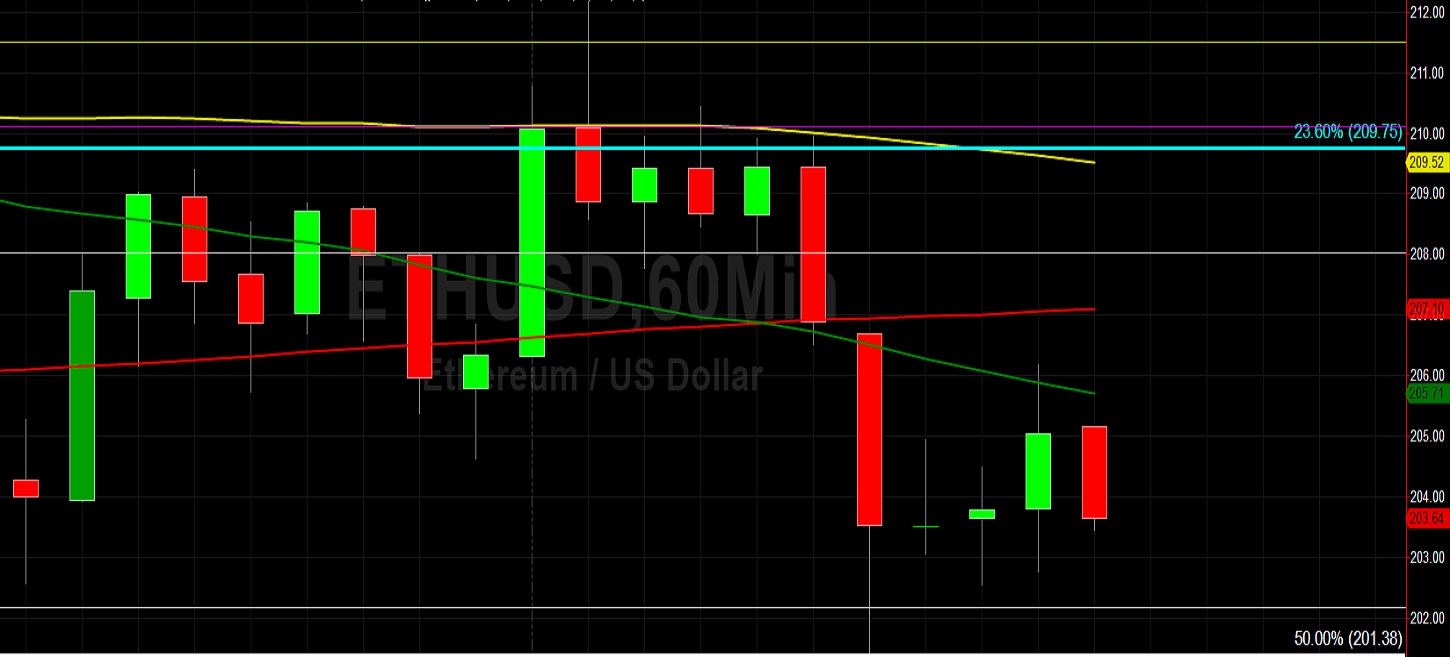
Price activity is nearest the 50-bar MA (4-hourly) at 207.15 and the 50-bar MA (Hourly) at 205.71.
Technical Support is expected around 193.00/ 189.60/ 184.01 with Stops expected below.
Technical Resistance is expected around 227.50/ 232.88/ 242.09 with Stops expected above.
On 4-Hourly chart, SlowK is Bearishly below SlowD while MACD is Bearishly below MACDAverage.
On 60-minute chart, SlowK is Bullishly above SlowD while MACD is Bearishly below MACDAverage.