Bitcoin (BTC/USD) extended its recent push towards the 10000 figure in today’s Asian session as traders elected Stops above the 9575.05 and 9753.86 levels during yesterday’s North American session, upside price objectives related to buying activity that originated around the 3858.00 level in March. Some minor Stops were elected below the 9080.39 area during the pullback in yesterday’s Asian session, a downside price objective that represents the 38.2% retracement of the recent appreciation from 8533.98 to 9418.00. Bullish market indications emerged thereafter as traders were able to keep BTC/USD bid above the 9225.75 area, a level that represents the 76.4% retracement of the recent depreciation from 9478.66 to 8407.00. Similarly, these bids were above the 9214.67 level, an important downside price objective related to selling pressure that emerged around the 10522.51 area in February, and this was also a bullish indication.
Large Stops were elected last week above several important levels including the 9362.24, 9214.67, 9082.20, 8763.40, 8405.58, 8162.36, 7832.92, and 7751.67 areas, and traders will closely monitor these levels when they are tested again. If BTC/USD is able to resume its upward trajectory, traders will closely monitor additional upside price objectives around the 9753.86 and 9982.41 levels. When BTC/USD pulls back from current price activity, traders will pay close attention to some additional areas of potential technical support, including the 8324.00, 7967.33, 7610.66, 7423.22, and 7169.35 levels. Chartists are observing that the 50-bar MA (4-hourly) continues to indicate above the 100-bar MA (4-hourly) and 200-bar MA (4-hourly). Also, the 50-bar MA (hourly) bullishly moved above the 100-bar MA (hourly), and continues to indicate above the 200-bar MA (hourly).
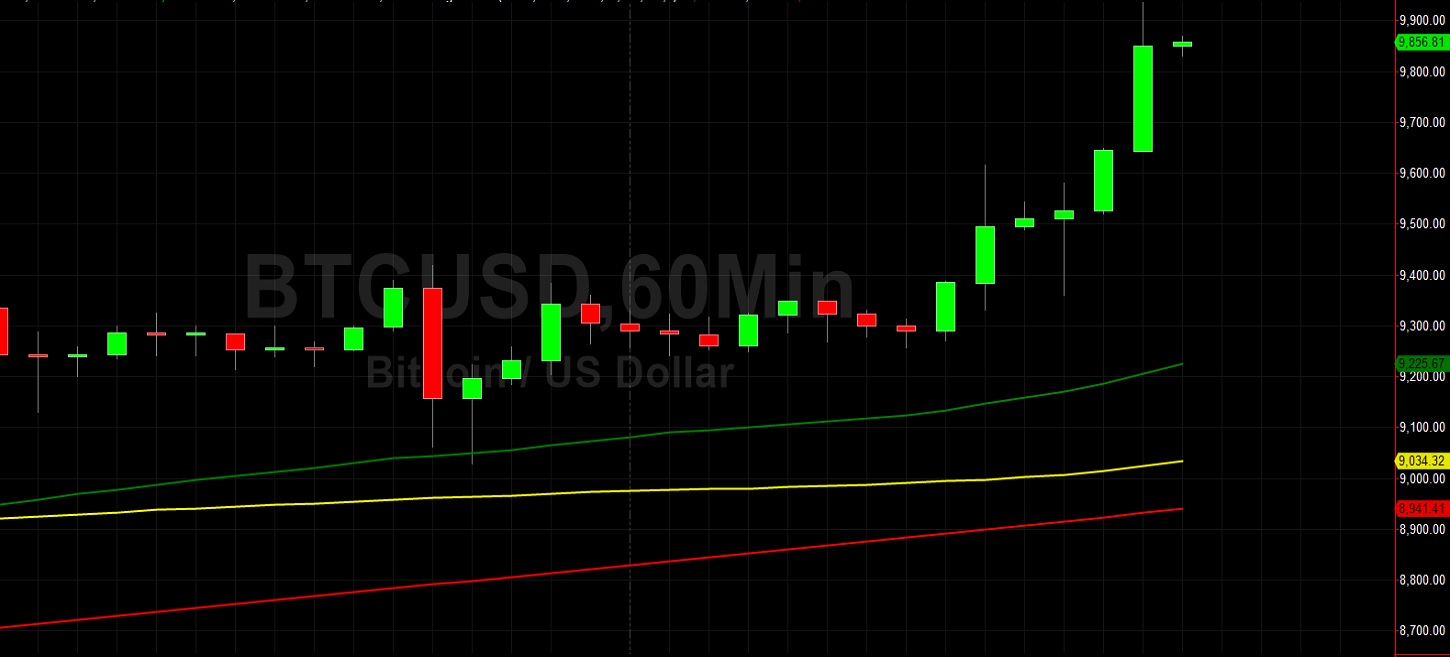
Price activity is nearest the 50-bar MA (4-hourly) at 8959.02 and the 50-bar MA (Hourly) at 9206.01.
Technical Support is expected around 9362.24/ 9082.20/ 8324.00 with Stops expected below.
Technical Resistance is expected around 10316.39/ 10661.23/ 11341.05 with Stops expected above.
On 4-Hourly chart, SlowK is Bullishly above SlowD while MACD is Bullishly above MACDAverage.
On 60-minute chart, SlowK is Bullishly above SlowD while MACD is Bullishly above MACDAverage.