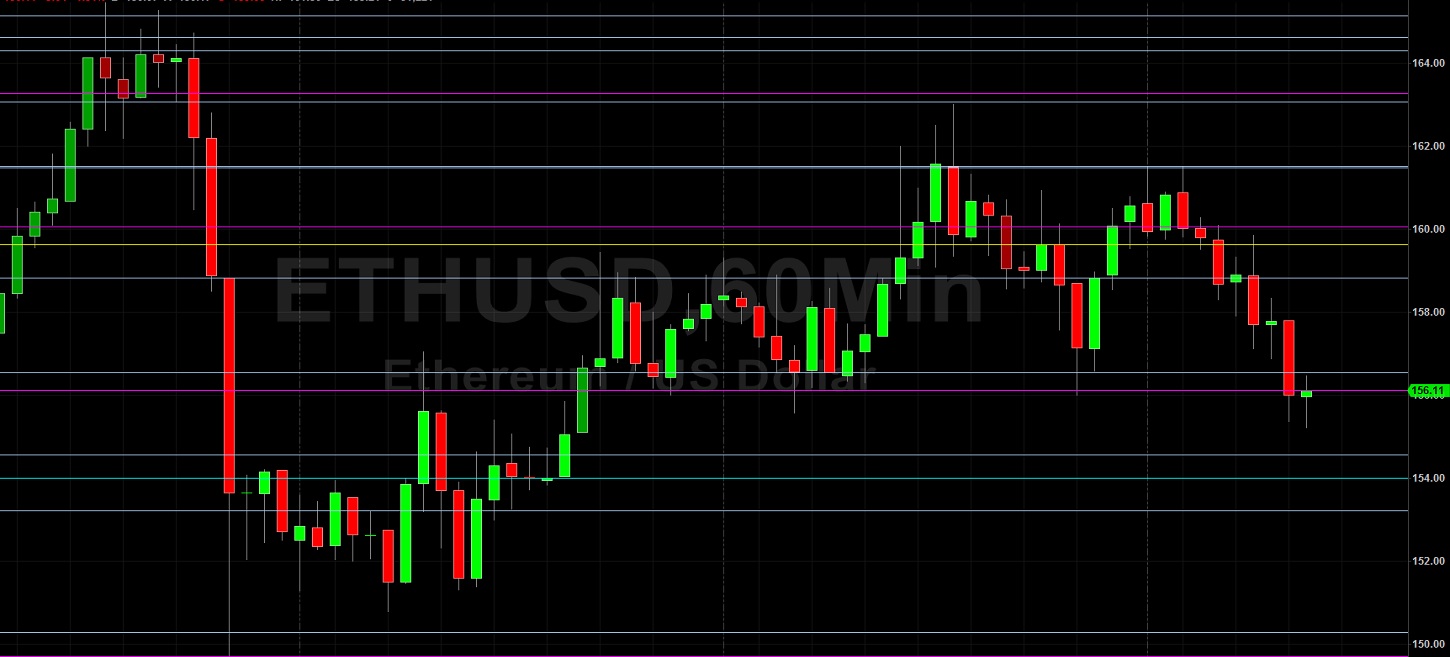
Ethereum (ETH/USD) remained pressured in today’s North American session as the pair weakened to the 155.61 level after selling pressure emerged around the 161.50 area during today’s Asian and European sessions, a very important level that served as technical support on 7 April. The pressure that the pair encountered there today knocked the pair lower and some Stops were again reached below the 156.10 area, a downside price objective related to selling pressure that emerged around the 176.82 area earlier this month. Traders are curious to see how price activity will react around the 154.57 and 149.31 levels, representing the 61.8% and 76.4% retracements of the appreciation from 140.81 to 176.82. Another important range that traders are monitoring is the appreciation from 123.82 to 176.72, with the 150.27 level representing the 50% retracement and the 144.00 level representing the 61.8% retracement.
Chartists are also observing that ETH/USD needs to make a decisive break above the 168.14 level before it can make a run at some of the recent highs established in early April. Notably, the 161.62 area is also technically significant because it represents a downside price objective related to the 252.99 area that traded in early March. Another very important level that traders are watching is the 159.62 level, an upside price objective related to buying pressure that emerged around the 90.00 level in March. If the pair is able to resume its upward trajectory above current price activity, additional upside price objectives include the 164.56, 167.45, and 171.03 levels. Below current price activity, downside price objectives include the 150.27, 149.31, 144.00, and 136.25 levels. Chartists are observing that the 50-bar MA (4-hourly) bullishly continues to indicate above the 100-bar MA (4-hourly) and 200-bar MA (4-hourly). Also, the 50-bar MA (hourly) just bullishly crossed above the 100-bar MA (hourly), and both continue to indicate below the 200-bar MA (hourly).
Price activity is nearest the 100-bar MA (4-hourly) at 151.69 and the 100-bar MA (Hourly) at 157.65.
Technical Support is expected around 153.22/ 149.31/ 146.77 with Stops expected below.
Technical Resistance is expected around 164.56/ 167.45/ 176.82 with Stops expected above.
On 4-Hourly chart, SlowK is Bearishly below SlowD while MACD is Bullishly above MACDAverage.
On 60-minute chart, SlowK is Bearishly below SlowD while MACD is Bearishly below MACDAverage.