Published
4 years ago on
April 05, 2020
Bitcoin (BTC/USD) continued to orbit the 6800 level early in today’s Asian session as the pair weakened from the 6915.17 area during yesterday’s European session and traded as low as the 6658.16 area early in yesterday’s North American session. Prior to the pullback, the pair has been orbiting the psychologically-important 7000 figure, after recently trading as high as the 7292.11 level, a multi-week high, before paring gains lower to the 6650.00 area. Stops were recently elected above some key technical levels during this sharp move higher. These levels include the 6979.43 level, an upside price objective related to upside buying pressure that emerged around the 3858 level in March, followed by Stops that were triggered above the 7059, 7101, and 7234 areas. A couple of clues emerged late in the week including traders’ inability to push BTC/USD above the 6949.09 area during a retracement higher, a level that represents the 50% retracement of the depreciation from 7292.11 to 6606.06.
Some of these upside price objectives were related to buying pressure that emerged around the 5001.00 level, another important technical level that printed last month. The move higher represents the pair’s first trading activity above the psychologically-important 7000.00 figure since early March when BTC/USD cratered from the 9214 area to the 3858 level. Above current price activity, upside price objectives include the 7414, 7561, 7716, and 7870 levels. Below current price activity, downside price objectives include the 6572, 6402, and 6192 levels. Chartists are observing that the 50-bar MA (hourly) recently crossed above the 200-bar MA (hourly), a very bullish signal, and that the 50-bar MA (4-hourly) is bearishly converging with the 100-bar MA (4-hourly).
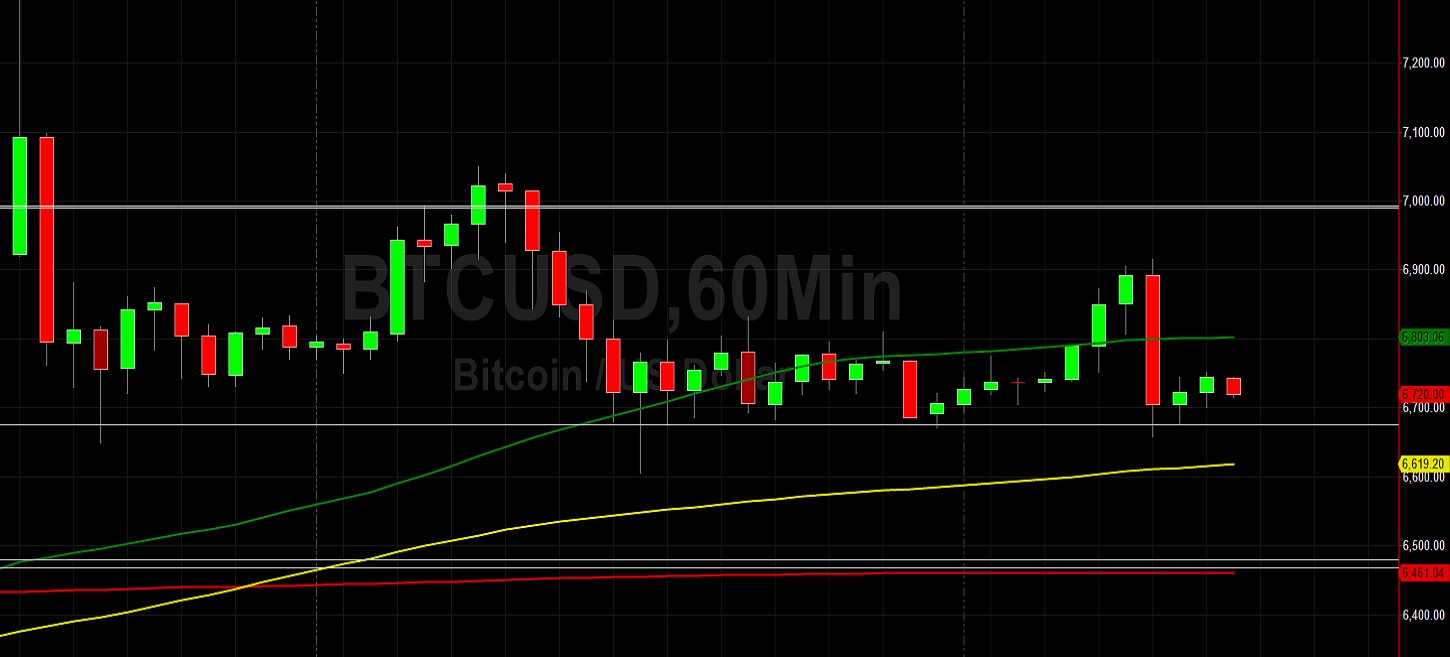
Price activity is nearest the 200-bar MA (4-hourly) at 6825.79 and the 50-bar MA (Hourly) at 6803.10.
Technical Support is expected around 6572.63/ 6481.88/ 6383.48 with Stops expected below.
Technical Resistance is expected around 7414.53/ 7561.96/ 7716.85 with Stops expected above.
On 4-Hourly chart, SlowK is Bearishly below SlowD while MACD is Bearishly below MACDAverage.
On 60-minute chart, SlowK is Bearishly below SlowD while MACD is Bearishly below MACDAverage.
Investment Disclaimer