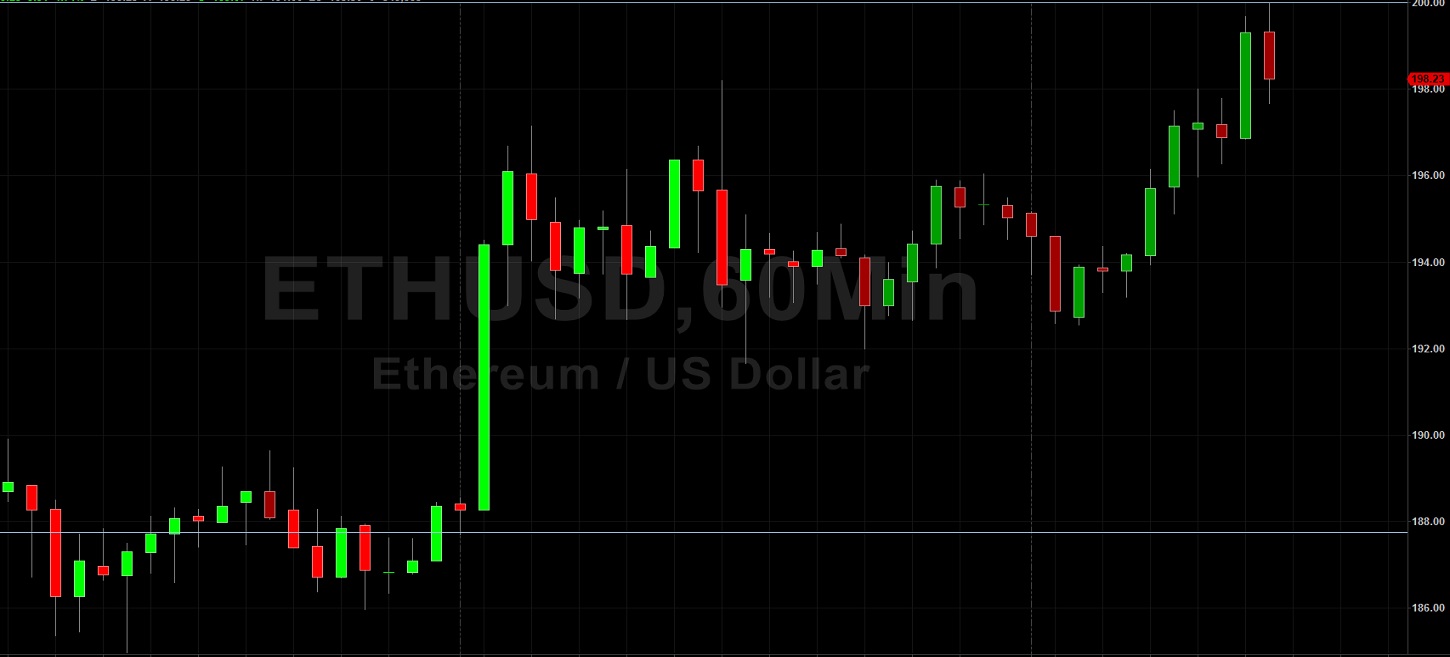
Ethereum (ETH/USD) established fresh multi-week highs in today’s North American session as the pair traded as high as the psychologically-important 200.00 figure after Stops were elected above the 199.16 area, an upside price objective related to buying pressure that originated around the 90.00 level in March. During Saturday’s North American session, traders absorbed the 198.09 area, representing an upside price objective and exhaustion point related to buying pressure that originated around the 90.00 area last month. Now that the 200.00 figure has been tested, traders are curious to see what will transpire around the 193.54 and 190.66 area, representing the 23.6% and 38.2% retracements of the recent appreciation from 178.46 to 198.20. Chartists are also observing that the market remained above the 184.72 level during a pullback last week, a level that represents the 61.8% retracement of the appreciation from 178.46 to 194.86.
The 184.01 area remains an important technical level for the pair, an upside price objective related to buying pressure that emerged around the 90.00 level in March. If the pair is able to resume its upward trajectory above current price activity, additional upside price objectives include the 206.29 and 213.05 levels. Below current price activity, downside price objectives include the 176.99, 171.47, and 165.95 levels. Chartists are observing that the 50-bar MA (4-hourly) bullishly continues to indicate above the 100-bar MA (4-hourly) and 200-bar MA (4-hourly). Also, the 50-bar MA (hourly) bullishly moved above the 100-bar MA (hourly), and continues to indicate above the 200-bar MA (hourly).
Price activity is nearest the 50-bar MA (4-hourly) at 183.37 and the 50-bar MA (Hourly) at 192.64.
Technical Support is expected around 184.01/ 176.99/ 171.47 with Stops expected below.
Technical Resistance is expected around 206.29/ 213.05/ 232.88 with Stops expected above.
On 4-Hourly chart, SlowK is Bullishly above SlowD while MACD is Bullishly above MACDAverage.
On 60-minute chart, SlowK is Bearishly below SlowD while MACD is Bullishly above MACDAverage.