Published
4 years ago on
April 06, 2020
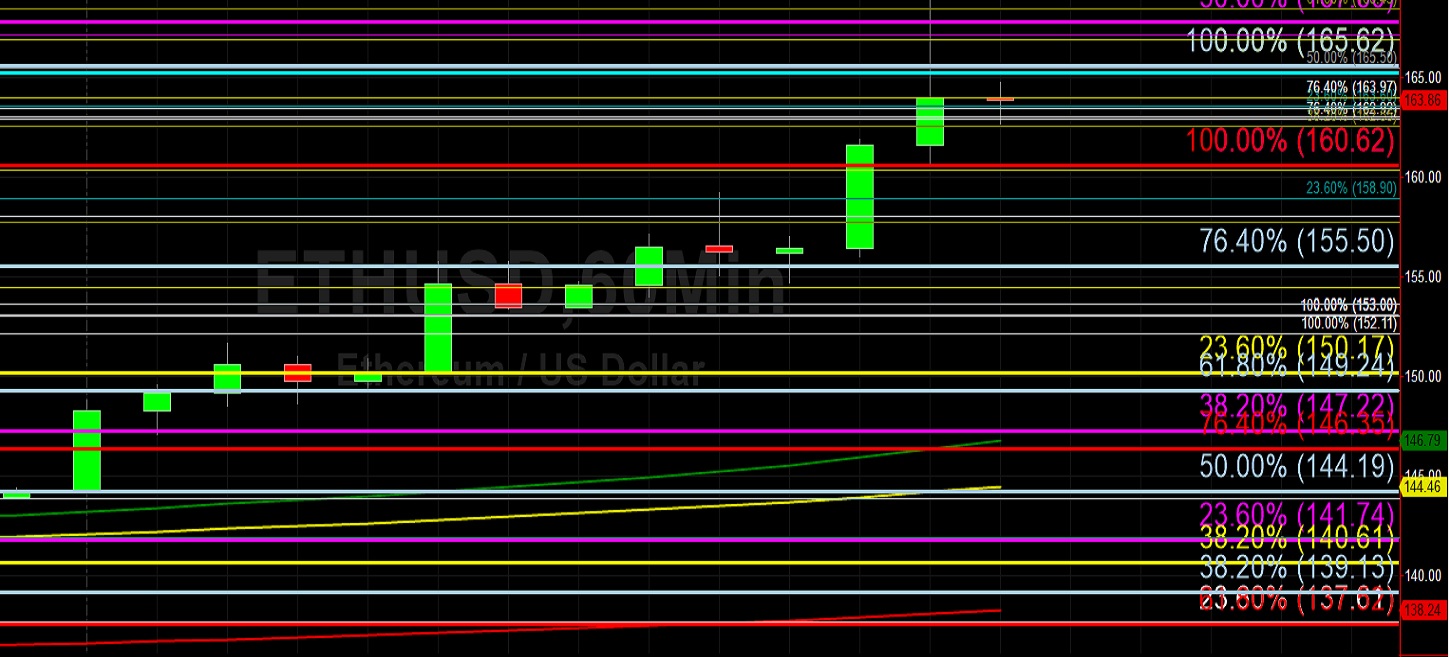
Ethereum (ETH/USD) appreciated in today’s North American session as the pair climbed higher to the 165.13 level after buying pressure emerged around the 153.39 area during today’s European session. The pair has been consistently bid higher since yesterday’s North American session when the pair traded as low as the 140.81 area. Stops were elected above a couple of key technical areas, including the 156.77 and 159.62 areas, both of which represent upside price objectives related to buying pressure that emerged around the 90.00 level during the volatile trading activity from mid-March.
Market sentiment is decidedly more positive than it was in late March when the pair traded below the psychologically-important 125.00 figure. The recent price appreciation from last week represents the pair’s first trading activity above the psychologically-important 150.00 figure since 20 March. Above that area, traders will pay close attention to levels that were technically significant when price activity precipitously declined from the 253.01 area in early March. Above current market activity, upside price objectives include the 168.14, 172.55, 186.60, and 198.05 levels. Below current market activity, downside price objectives include the 155.86, 152.99, and 150.11 levels. Chartists are observing that the 50-bar MA (4-hourly) remains bearishly below the 200-bar MA (4-hourly), and that the 50-bar MA (hourly) bullishly continues to indicate above the 100-bar MA (hourly) and 200-bar MA (hourly).
Price activity is nearest the 200-bar MA (4-hourly) at 151.94 and the 50-bar MA (Hourly) at 146.80.
Technical Support is expected around 159.62/ 156.77/ 153.22 with Stops expected below.
Technical Resistance is expected around 177.39/ 196.54/ 206.29 with Stops expected above.
On 4-Hourly chart, SlowK is Bullishly above SlowD while MACD is Bullishly above MACDAverage.
On 60-minute chart, SlowK is Bearishly below SlowD while MACD is Bullishly above MACDAverage.
Investment Disclaimer