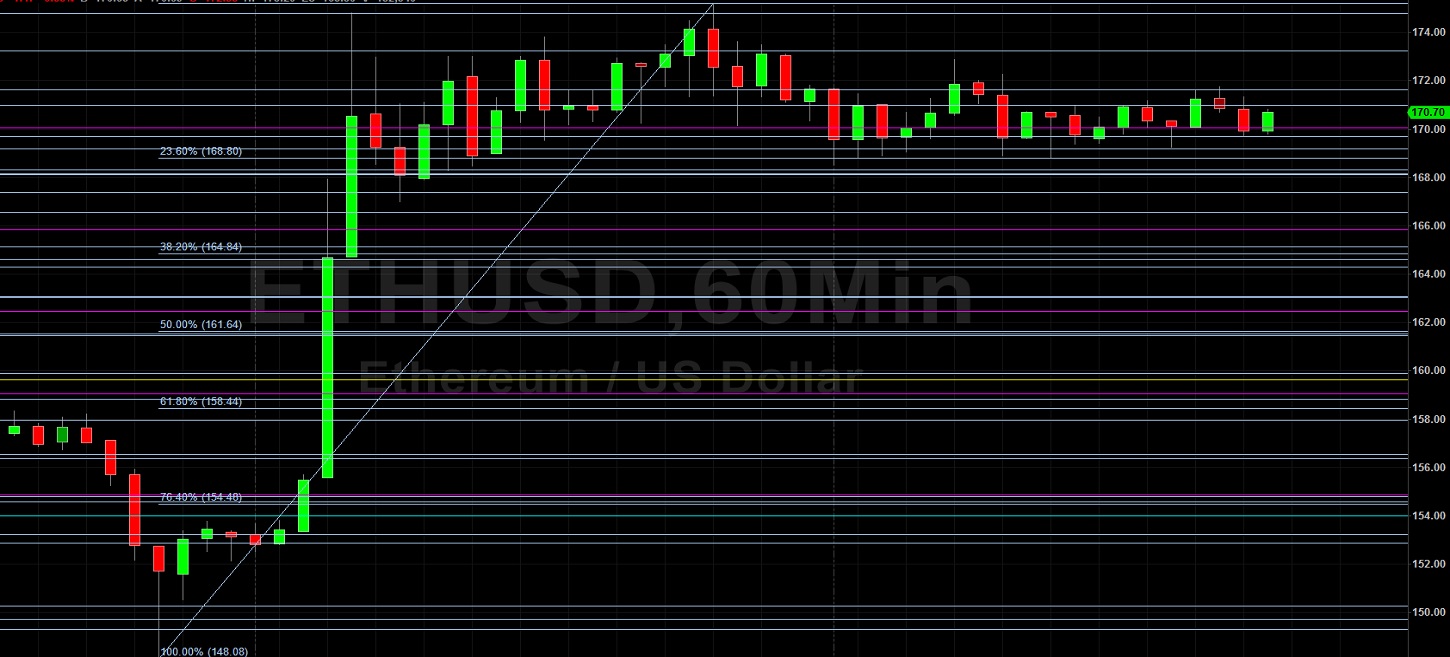
Ethereum (ETH/USD) traded sideways in today’s North American session as the pair traded as low as the 168.79 area before moving higher to the 171.60 area. Traders lifted ETH/USD back above the 175.00 level for the first time since last week during today’s Asian session after some technical resistance developed around the 174.77 area was eventually absorbed. Some buying pressure emerged around the 170.04 area during a pullback in Thursday’s North American session and yesterday’s Asian session, a level that represents the 76.4% retracement of the depreciation from 176.82 to 148.08. Below current price activity, traders will be curious to see how price activity will react around the 154.57 and 149.31 levels, representing the 61.8% and 76.4% retracements of the appreciation from 140.81 to 176.82. Another important range that traders are monitoring is the appreciation from 123.82 to 176.72, with the 150.27 level representing the 50% retracement and the 144.00 level representing the 61.8% retracement.
Another very important level that traders are watching is the 159.62 level, an upside price objective related to buying pressure that emerged around the 90.00 level in March. If the pair is able to resume its upward trajectory above current price activity, additional upside price objectives include the 176.82, 177.39, and 196.54 levels. Below current price activity, downside price objectives include the 144.00, 140.81, and 136.25 levels. Chartists are observing that the 50-bar MA (4-hourly) bullishly continues to indicate above the 100-bar MA (4-hourly) and 200-bar MA (4-hourly). Also, the 200-bar MA (hourly) just bullishly crossed above the 200-bar MA (hourly), and the 50-bar MA (hourly) continues to bullishly indicate both.
Price activity is nearest the 50-bar MA (4-hourly) at 160.97 and the 50-bar MA (Hourly) at 167.40.
Technical Support is expected around 153.22/ 149.31/ 146.77 with Stops expected below.
Technical Resistance is expected around 176.82/ 177.39/ 196.54 with Stops expected above.
On 4-Hourly chart, SlowK is Bullishly above SlowD while MACD is Bullishly above MACDAverage.
On 60-minute chart, SlowK is Bearishly below SlowD while MACD is Bearishly below MACDAverage.