Published
4 years ago on
April 07, 2020
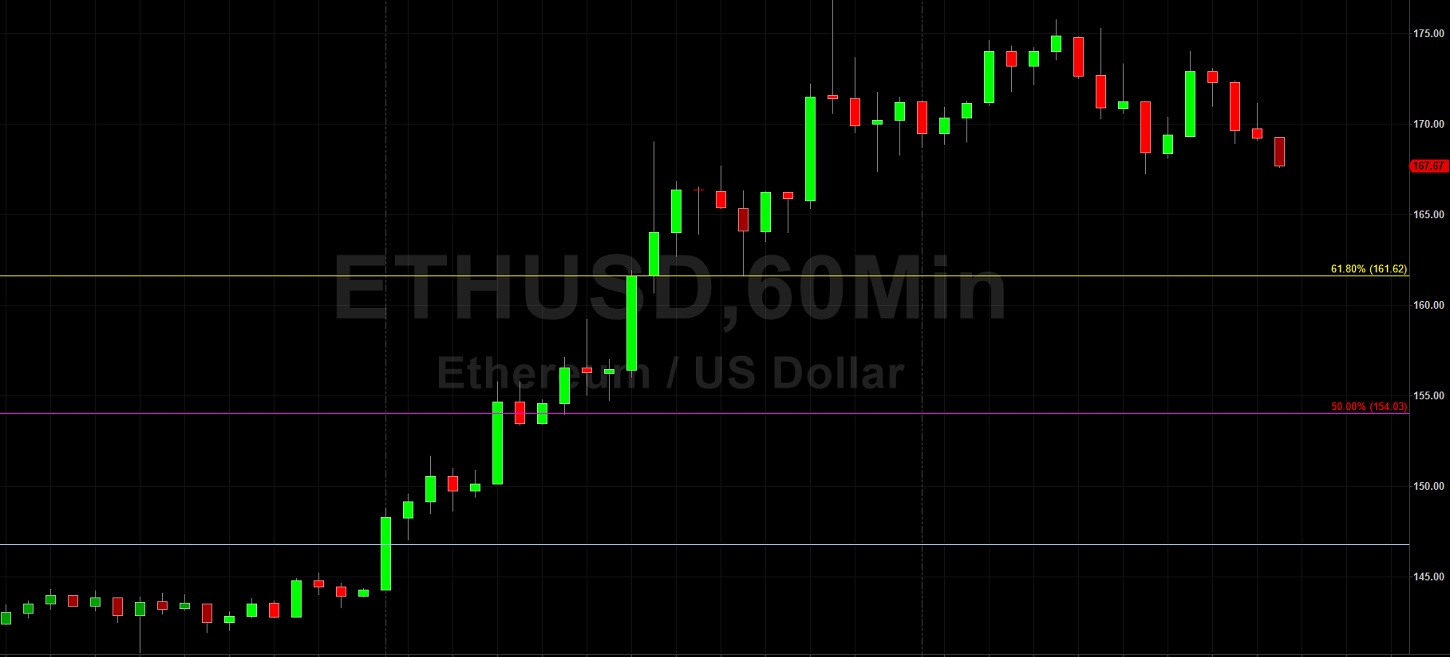
Ethereum (ETH/USD) gave back some recent gains in today’s North American session as the pair traded as low as the 167.24 area after trading as high as the 176.82 area during today’s Asian session. Traders have pushed the pair through a series of Stops during the recent climb of ETH/USD to multi-week highs as traders have assumed more market risk and exhibited declining risk aversion. Stops were elected above the 153, 156, 159, 168, and 172 areas during the ETH/USD’s appreciation, upside price objectives related to last month’s low around the 90.00 area. Another important level above which Stops were elected is the 161.62 area, a level that is a downside price objective related to selling pressure that emerged around the 252.99 area in early March. Notably, another downside price objective related to this same area of selling pressure is the 177.39 area, and ETH/USD today stopped just short of testing this level. Above current price activity, additional upside price objectives include the 186.60 and 198.05 areas.
Traders note that the pair absorbed some Stops above the 154.00 area during its recent ascent back above the psychologically-important 150.00 area, a price level that previously had been reached on 20 March. The pair’s improving market sentiment having traders curious to see how ETH/USD will react around technical support at some technically significant levels that include the 168.32, 163.06, 158.82, 154.57, and 149.31 levels. Additional buying pressure could emerge around the 144.00 and 136.25 areas. Chartists are observing that the 50-bar MA (4-hourly) remains bearishly below the 200-bar MA (4-hourly), and that the 50-bar MA (hourly) bullishly continues to indicate above the 100-bar MA (hourly) and 200-bar MA (hourly).
Price activity is nearest the 200-bar MA (4-hourly) at 151.94 and the 50-bar MA (Hourly) at 146.80.
Technical Support is expected around 159.62/ 156.77/ 153.22 with Stops expected below.
Technical Resistance is expected around 177.39/ 196.54/ 206.29 with Stops expected above.
On 4-Hourly chart, SlowK is Bearishly below SlowD while MACD is Bullishly above MACDAverage.
On 60-minute chart, SlowK is Bearishly below SlowD while MACD is Bearishly below MACDAverage.
Investment Disclaimer