Ethereum (ETH/USD) shied away from the 200.00 figure in today’s North American session as the pair declined to the 195.49 level after trading as high as the 197.95 area earlier in the North American session, just below the 198.09 area that represents an upside price objective related to buying pressure that originated around the 90.00 area in March. During a pullback during yesterday’s North American session, the pair traded as low as the 189.60 area, just above the 189.23 level that represents the 50% retracement of the recent appreciation from 178.46 to 200.00. Additional downside targets related to this range include the 186.69 and 183.54 levels. Chartists are also observing that the market remained above the 184.72 level during a pullback last week, a level that represents the 61.8% retracement of the appreciation from 178.46 to 194.86.
The 184.01 area remains an important technical level for the pair, an upside price objective related to buying pressure that emerged around the 90.00 level in March. If the pair is able to resume its upward trajectory above current price activity, additional upside price objectives include the 206.29 and 213.05 levels. Below current price activity, downside price objectives include the 176.99, 171.47, and 165.95 levels. Chartists are observing that the 50-bar MA (4-hourly) bullishly continues to indicate above the 100-bar MA (4-hourly) and 200-bar MA (4-hourly). Also, the 50-bar MA (hourly) continues to indicate above the 100-bar MA (hourly), and continues to indicate above the 200-bar MA (hourly).
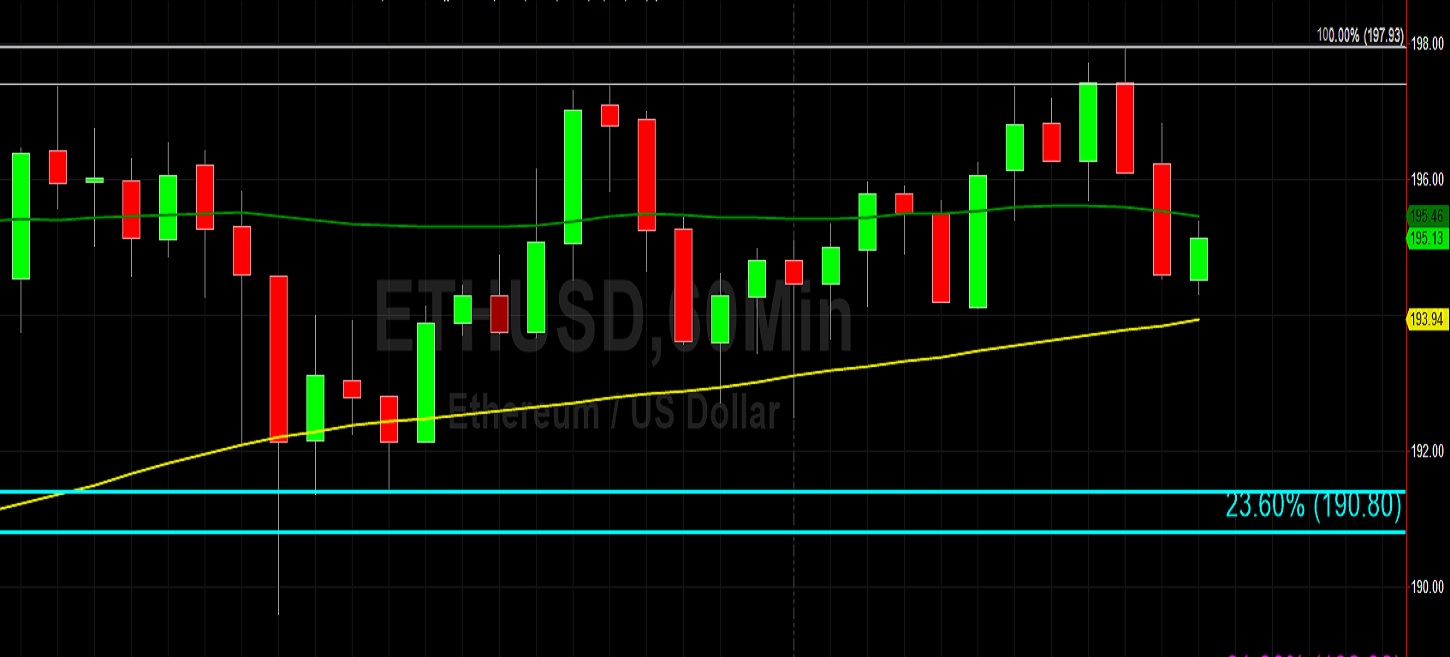
Price activity is nearest the 50-bar MA (4-hourly) at 186.43 and the 50-bar MA (Hourly) at 195.46.
Technical Support is expected around 184.01/ 176.99/ 171.47 with Stops expected below.
Technical Resistance is expected around 206.29/ 213.05/ 232.88 with Stops expected above.
On 4-Hourly chart, SlowK is Bullishly above SlowD while MACD is Bearishly below MACDAverage.
On 60-minute chart, SlowK is Bearishly below SlowD while MACD is Bullishly above MACDAverage.