Published
4 years ago on
April 08, 2020
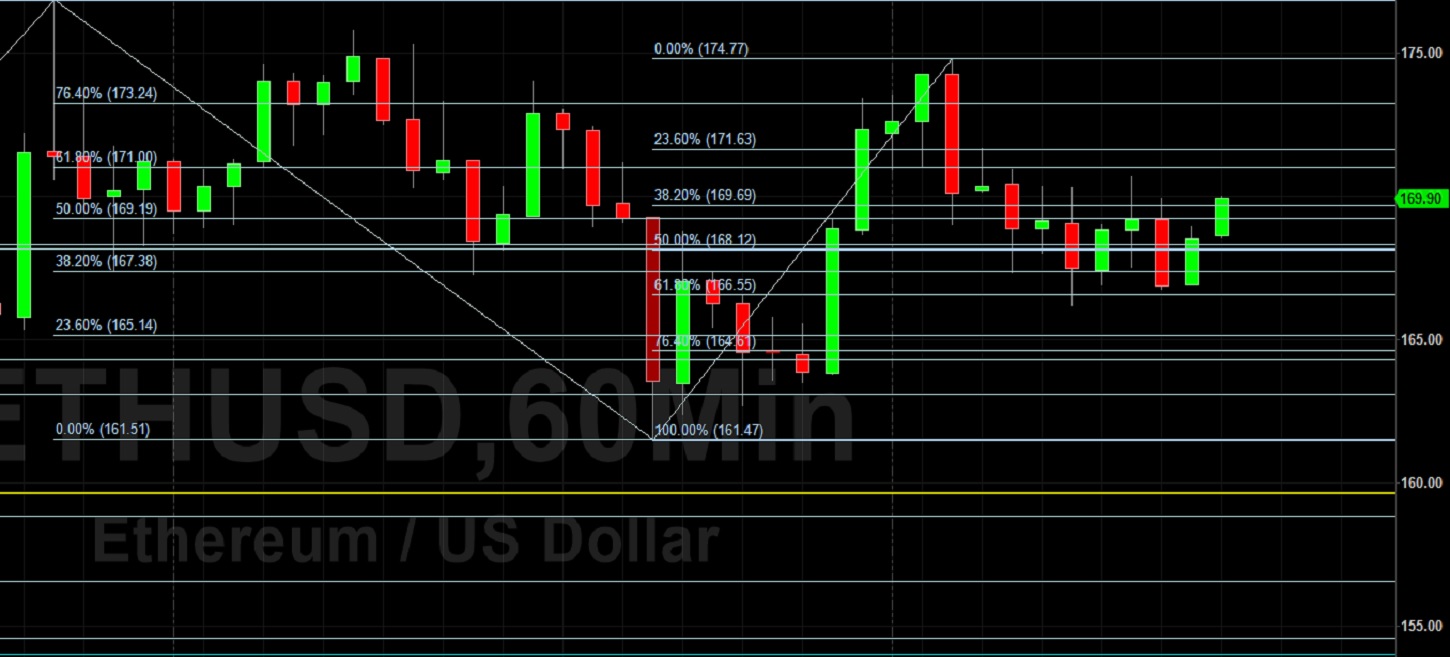
Ethereum (ETH/USD) extended recent gains in today’s North American session as the pair continued to climb above the psychologically-important 150.00 level. Buying pressure emerged around the 166.18 level during today’s European market, just below the 61.8% retracement of the appreciation from 161.47 to 174.77. Selling pressure earlier emerged around the 171.63 area, representing the 23.6% retracement of this range. Significant selling pressure emerged around the 173.99 area during Tuesday’s North American session, just above the 76.4% retracement of the depreciation from 175.76 to 167.24. Selling pressure intensified around the 171.15 area, just above the 38.2% retracement of the depreciation from 173.99 to 168.93, and buying pressure finally emerged around the 161.47 area. ETH/USD then appreciated back above the 170.00 area.
During the pair’s recent appreciation to multi-week highs, Stops were executed above the 153, 156, 159, 168, and 172 areas, upside price objectives related to last month’s low around the 90.00 area. Above current price activity, additional upside price objectives include the 186.60 and 198.05 areas. Below current price activity, downside price objectives include the 158.82, 154.57, and 149.31 levels. Additional buying pressure could emerge around the 144.00 and 136.25 areas. Chartists are observing that the 50-bar MA (4-hourly) remains bearishly below the 200-bar MA (4-hourly), and that the 50-bar MA (hourly) bullishly continues to indicate above the 100-bar MA (hourly) and 200-bar MA (hourly).
Price activity is nearest the 200-bar MA (4-hourly) at 148.72 and the 50-bar MA (Hourly) at 168.82.
Technical Support is expected around 159.62/ 156.77/ 153.22 with Stops expected below.
Technical Resistance is expected around 177.39/ 196.54/ 206.29 with Stops expected above.
On 4-Hourly chart, SlowK is Bearishly below SlowD while MACD is Bearishly below MACDAverage.
On 60-minute chart, SlowK is Bullishly above SlowD while MACD is Bearishly below MACDAverage.
Investment Disclaimer