Ethereum (ETH/USD) sought to maintain gains early in today’s North American as the pair extended its recovery above the 170.00 level after trading as high as the 182.77 level during yesterday’s North American session. Stops were elected above the 180.28 level during the move higher, a level that represents the 76.4% retracement of the depreciation from 191.22 to 166.40. Additional Stops were triggered above the 181.04 area during the ascent, a technical level that represents the 23.6% retracement of the appreciation from 148.08 to 191.22. Traders are interested to observe how ETH/USD will react around the 184.01 area, an upside price objective related to buying pressure that emerged around the 90.00 level. Below current price activity, traders will be curious to see how price activity will react around the 154.57 and 149.31 levels, representing the 61.8% and 76.4% retracements of the appreciation from 140.81 to 176.82.
Also, another level that traders are watching is the 159.62 level, an upside price objective related to buying pressure that emerged around the 90.00 level in March. If the pair is able to resume its upward trajectory above current price activity, additional upside price objectives include the 196.54 and 206.29 levels. Below current price activity, downside price objectives include the 144.00, 140.81, and 136.25 levels. Chartists are observing that the 50-bar MA (4-hourly) bullishly continues to indicate above the 100-bar MA (4-hourly) and 200-bar MA (4-hourly). Also, the 50-bar MA (hourly) bearishly moved below the 100-bar MA (hourly), and continues to indicate above the 200-bar MA (hourly).
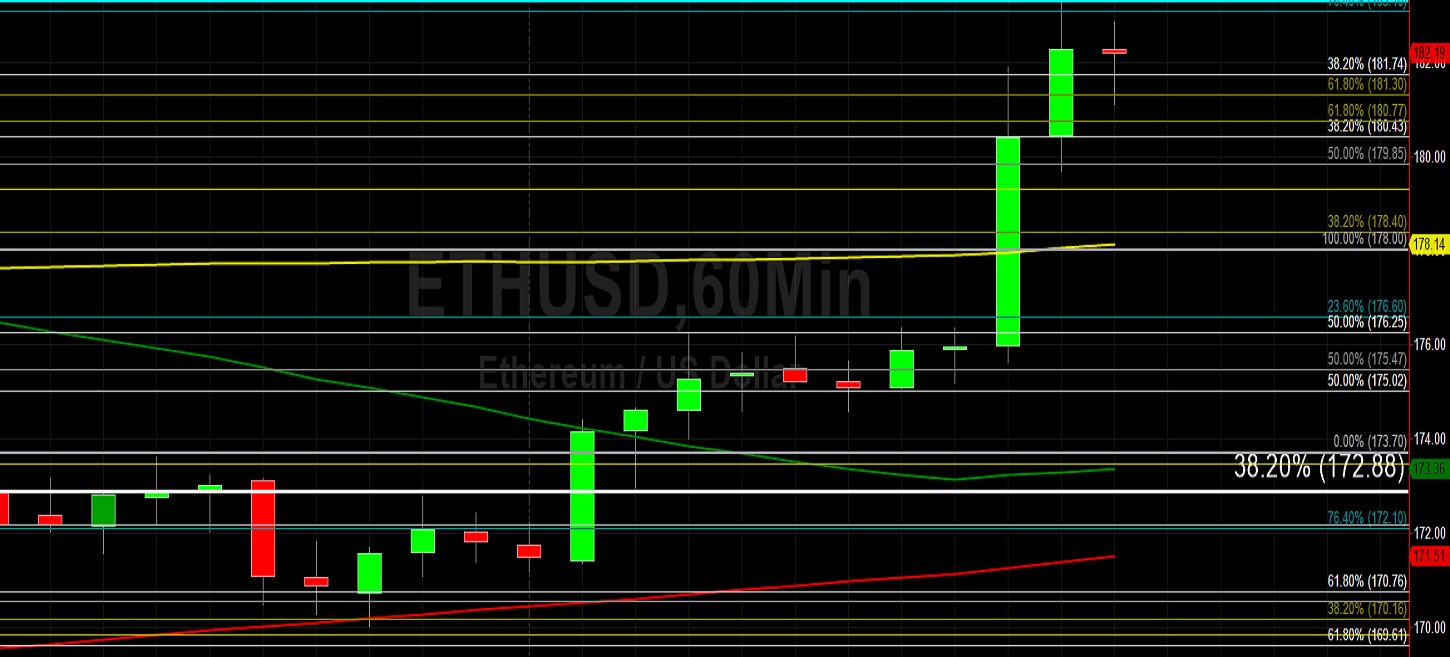
Price activity is nearest the 50-bar MA (4-hourly) at 171.51 and the 100-bar MA (Hourly) at 178.14.
Technical Support is expected around 164.56/ 158.26/ 150.27 with Stops expected below.
Technical Resistance is expected around 196.54/ 206.29/ 213.05 with Stops expected above.
On 4-Hourly chart, SlowK is Bullishly above SlowD while MACD is Bullishly above MACDAverage.
On 60-minute chart, SlowK is Bearishly below SlowD while MACD is Bullishly above MACDAverage.