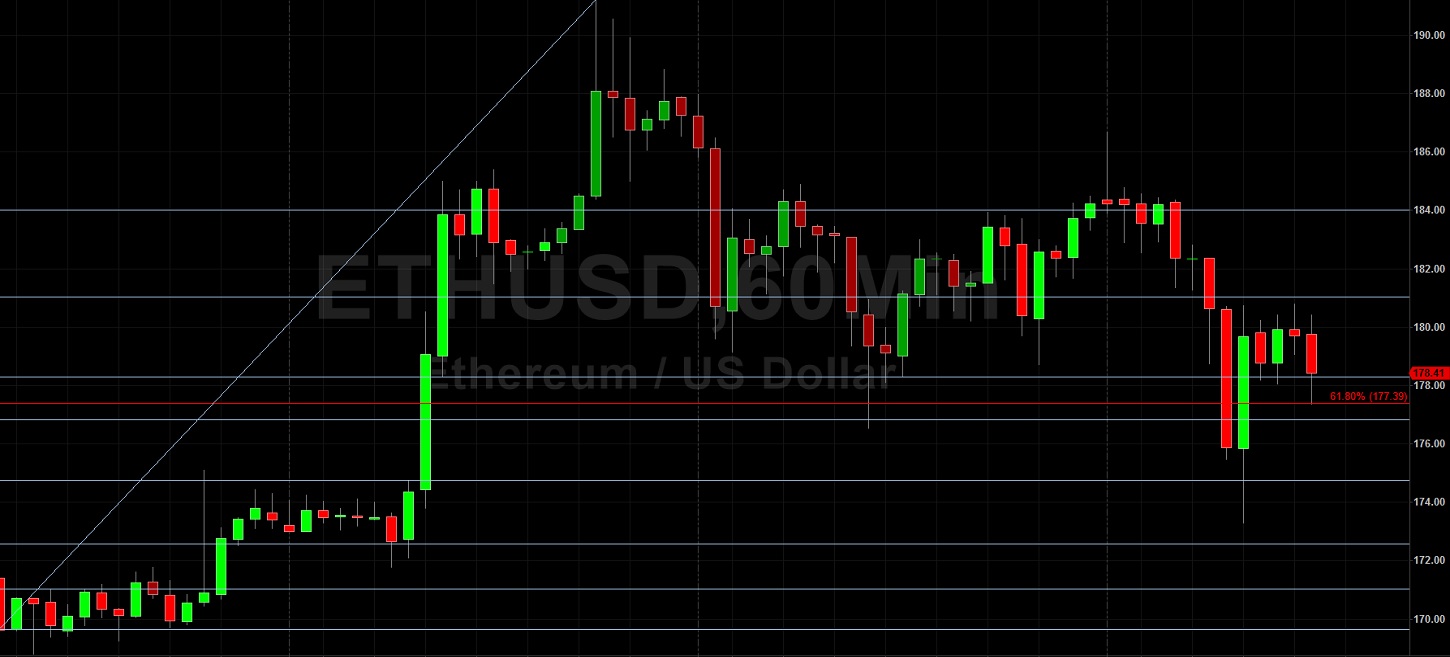
Ethereum (ETH/USD) reclaimed some lost ground in today’s North American session as the pair moved back above the 180.80 area after trading as low as the 173.29 level earlier in the North American session. Stops were elected below the 174.74 level during the move lower, a retracement level that represents the 38.2% retracement of the appreciation from 148.08 to 191.22. Some additional Stops were triggered below the 177.39 level, a downside price objective related to selling pressure that originated around the 252.99 level in March. Traders are eyeing the 169.65 and 164.56 levels as areas of possible technical support during pullbacks lower. Stops were reached during the weekend above the 177.39 area, a downside price objective related to selling pressure that emerged around the 252.99 area in March. Below current price activity, traders will be curious to see how price activity will react around the 154.57 and 149.31 levels, representing the 61.8% and 76.4% retracements of the appreciation from 140.81 to 176.82.
Another important range that traders are monitoring is the appreciation from 123.82 to 176.72, with the 150.27 level representing the 50% retracement and the 144.00 level representing the 61.8% retracement. Also, another level that traders are watching is the 159.62 level, an upside price objective related to buying pressure that emerged around the 90.00 level in March. If the pair is able to resume its upward trajectory above current price activity, additional upside price objectives include the 196.54 and 206.29 levels. Below current price activity, downside price objectives include the 144.00, 140.81, and 136.25 levels. Chartists are observing that the 50-bar MA (4-hourly) bullishly continues to indicate above the 100-bar MA (4-hourly) and 200-bar MA (4-hourly). Also, the 50-bar MA (hourly) bullishly continues to indicate above the 100-bar MA (hourly) and 200-bar MA (hourly).
Price activity is nearest the 50-bar MA (4-hourly) at 168.21 and the 100-bar MA (Hourly) at 177.54.
Technical Support is expected around 172.58/ 169.65/ 164.56 with Stops expected below.
Technical Resistance is expected around 196.54/ 206.29/ 213.05 with Stops expected above.
On 4-Hourly chart, SlowK is Bearishly below SlowD while MACD is Bearishly below MACDAverage.
On 60-minute chart, SlowK is Bearishly below SlowD while MACD is Bearishly below MACDAverage.