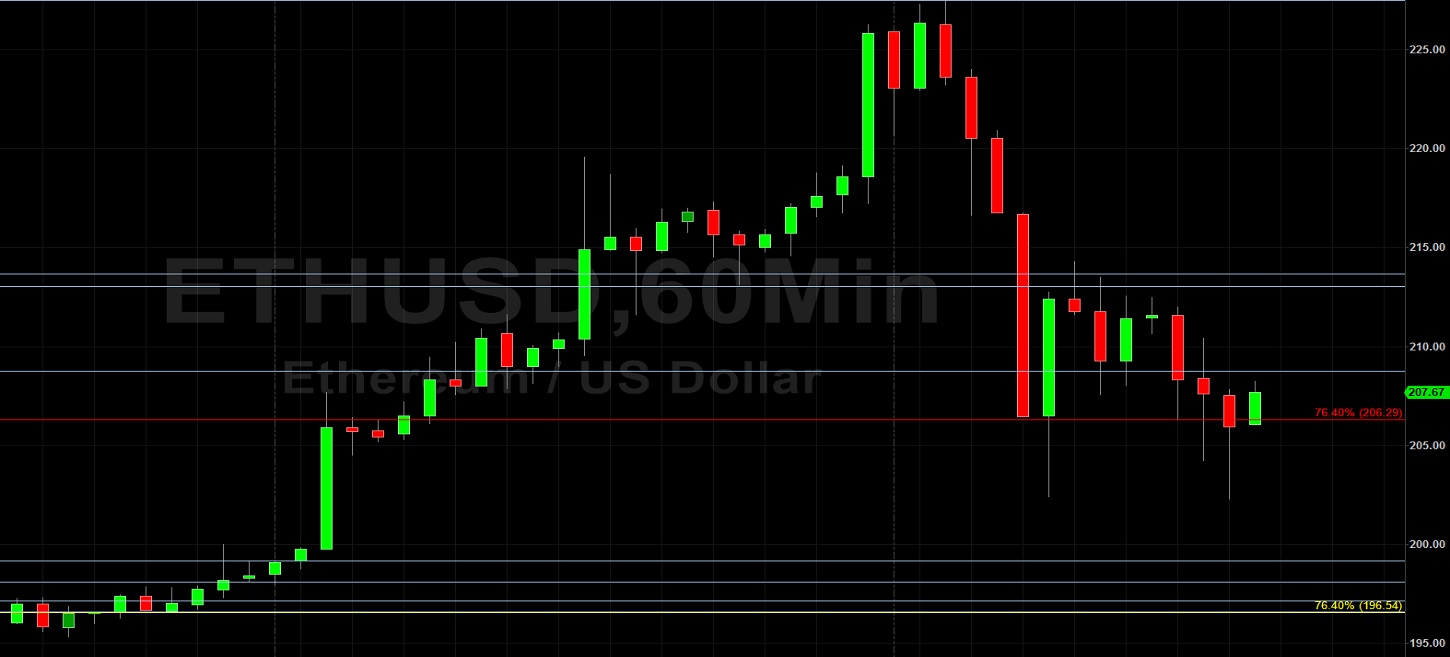
Ethereum (ETH/USD) gave back some recent strong gains during today’s North American session as the pair receded to the 202.30 level after trading as high as the 227.50 level during today’s Asian session. Stops were elected above the 213.05 level during yesterday’s North American session, an upside price objective related to buying activity that originated around the 90.00 level in March. Stops were elected above the 206.29 level during the rapid ascent this week, a level that represents the 76.4% retracement of the depreciation from 253.01 to 55.04. Additional Stops were reached above the 213.05 area during the appreciation, an upside price objective also related to the 90.00 level.
Above current price activity, traders will pay very close attention to the 232.88 and 242.09 areas, additional upside price objectives related to the 90.00 level, with Stops likely to be decent above the 232.88 area. When ETH/USD comes off, traders will pay close attention to levels including the 197.16, 187.79, 178.42, and 166.82 levels. Chartists are observing that the 50-bar MA (4-hourly) bullishly continues to indicate above the 100-bar MA (4-hourly) and 200-bar MA (4-hourly). Also, the 50-bar MA (hourly) continues to indicate above the 100-bar MA (hourly), and continues to indicate above the 200-bar MA (hourly).
Price activity is nearest the 50-bar MA (4-hourly) at 195.92 and the 50-bar MA (Hourly) at 208.80.
Technical Support is expected around 199.27/ 196.54/ 193.00 with Stops expected below.
Technical Resistance is expected around 227.50/ 232.88/ 242.09 with Stops expected above.
On 4-Hourly chart, SlowK is Bearishly below SlowD while MACD is Bearishly below MACDAverage.
On 60-minute chart, SlowK is Bearishly below SlowD while MACD is Bearishly below MACDAverage.