The first 3 months of the year are over, being a very chaotic period for financial markets driven by fear, volatility and negative sentiment across the world. Just to have a reference of the crypto market during this period, Bitcoin plunged from $10,500 in mid-February to around $4,000 three weeks later. Since the end of March, we are starting to see positive news for the crypto market as a whole. It seems that there is more confidence from investors as we can see relevant gains for all the major cryptocurrencies.
For today's article, the idea is to analyze the performance of Dash and what are the metrics driving its development as a relevant asset in the crypto market. Dash has been one of the highlights in the first months of the 2020 crypto market. The market dynamics of Dash seemed to have drastically shifted in the last few weeks. As of today (03/04), Dash is trading at $69.64 USD which represents a 62.5% YTD performance so far, standing out as one of the best performing crypto assets of the year.
Although the positive sentiment reached its peak on February 12 towards their YTD High mark of $133.51 USD, marking a remarkable ride for the year. Also, it is relevant to note that Dash has a market capitalization of $656 Million dollars with a strong daily trading volume ranking them as number 20 of most relevant crypto-assets.
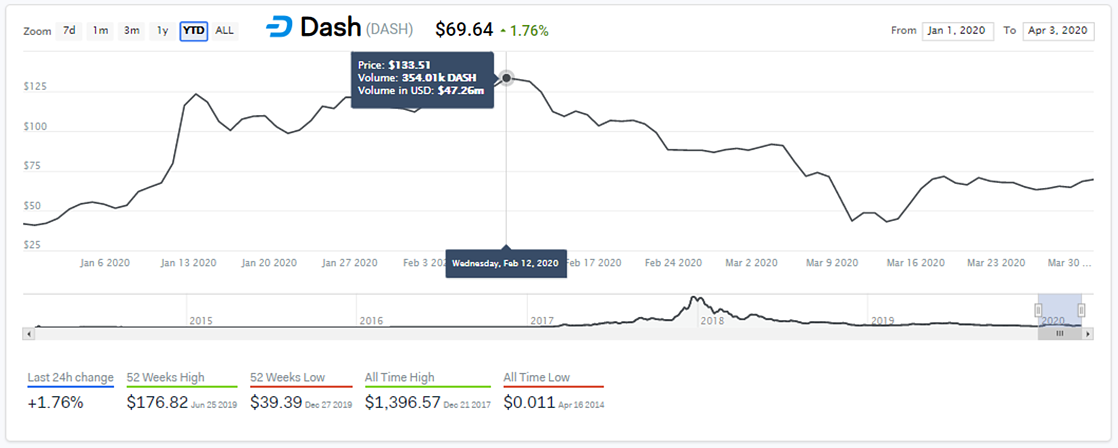
Dash usage has experienced decent growth since its inception. The cryptocurrency has a highly active community of users and is consistently adding nodes to its network. This cryptocurrency aims to become a medium for daily transactions that ensure users’ privacy and anonymity. It has become highly popular mainly due to some quite interesting features like InstantSend, PrivateSend and ChainLocks.
As a leading crypto-asset, Dash has captured the attention of traders and analysts all over the world, being among the biggest gainers of the year so far. Now I want to go deeper into the analysis of its performance using a data-driven approach leveraging the IntoTheBlock platform which combines hundreds of factors to extract unique insights about the asset.

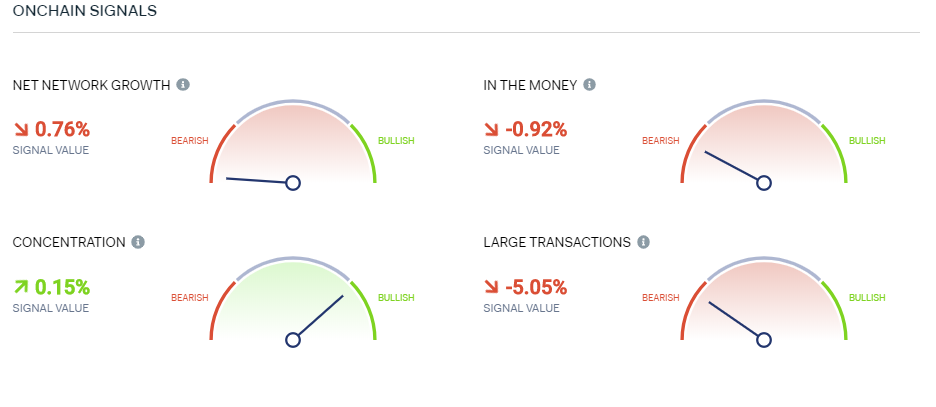
To start, we can see how the “Quick View” Signals reveal that currently there a mostly bearish sentiment on Dash The Actionable Signals section below contains momentum signals based on IntoTheBlock’s underlying indicators that provide a bullish or bearish sign based on onchain indicators. For example, the Net Network Growth is slowing when we consider the number of new addresses and addresses going to a zero balance. This may be interpreted as a sign that the pace of adoption of the network is not fast enough. Also, there is evidence of “Large Transactions” going down, This indicator tracks on-chain transactions larger than $100k that can be considered as movements from big or institutional players. The ¨Concentration¨ signal is the only one bullish, being a sign of concentration from Large Holders.
 What Blockchain Data Tells Us About Dash
- Taking a look at Dash holders around the current price
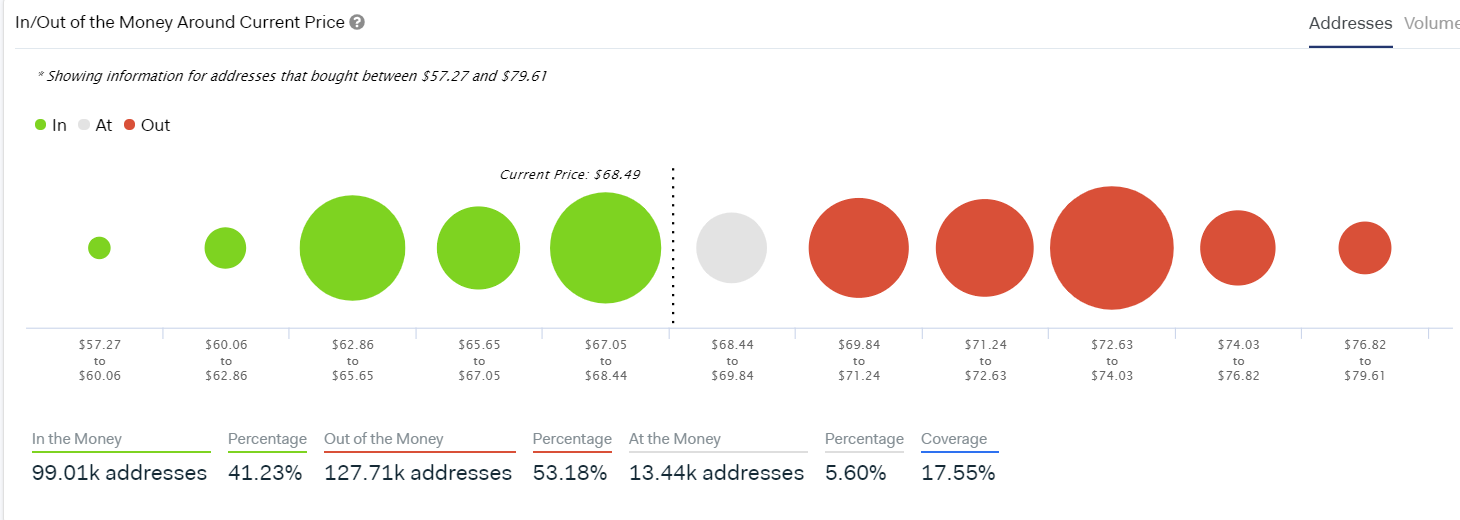
In the graph below, we can see addresses that bought Dash between $57.27 and $79.71. IntoTheBlock’s “In/Out of the Money Around Current Price” model reveals that 13.44k addresses bought 198.91k Dash at an average price of $69.07. This gray cluster of holders can be considered as a resistance area for the upward trajectory of the price.
- Holders have a long term attitude towards Dash.
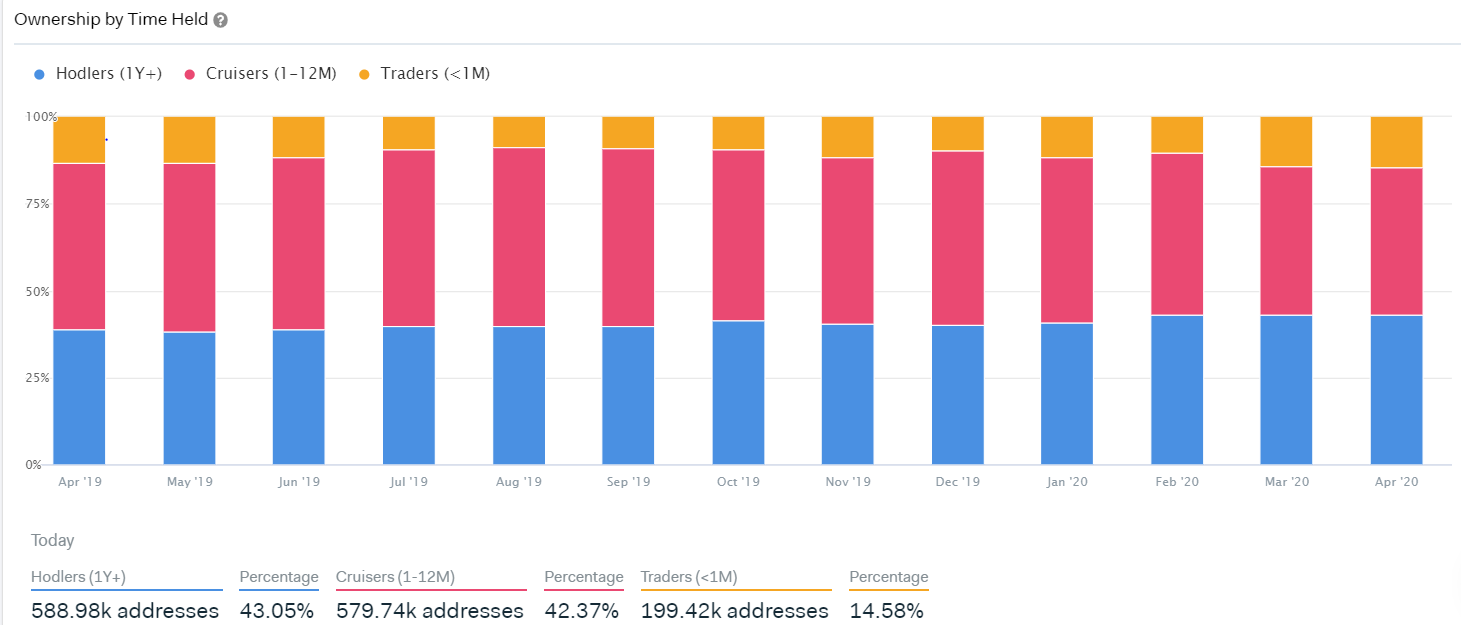
IntoTheBlock’s “Ownership by Time Held” analysis segments addresses based on their average holding periods. Below we can see the Hodlers indicator that covers the number of long term holders (those that hold longer than 1 year and the Cruisers indicator that covers the number of medium term holders (those that hold the token between 1 month and 12 month). The vast number of holders are mid to long term with a dominance of 85% representing 1,167 million addresses.
- Dash price volatility is going up.
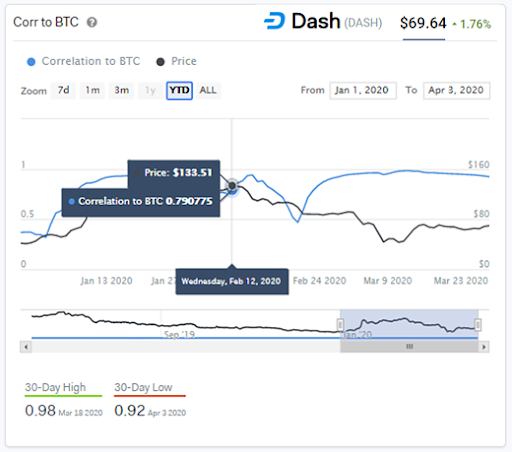
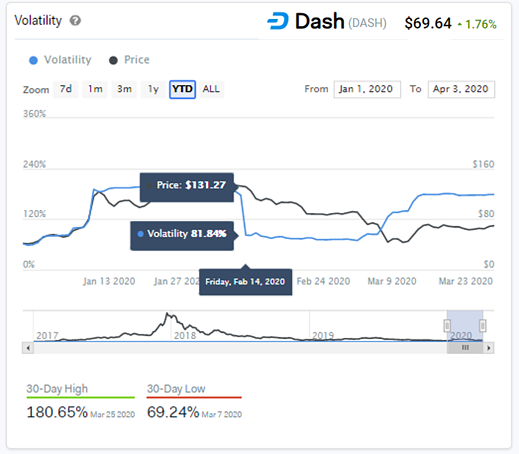
In the graph below we can see a spike in the price volatility for Dash reaching a high level of 196% on January 24th, maintaining the volatility above 100% since mid-January. Also, it is worth mentioning how Dash is usually strongly correlated to Bitcoin’s price. Although, we can see also how the correlation decreased to 0.79 when the price of Dash reached $133.51.
- Dash Holders are mostly western Retail Investors.
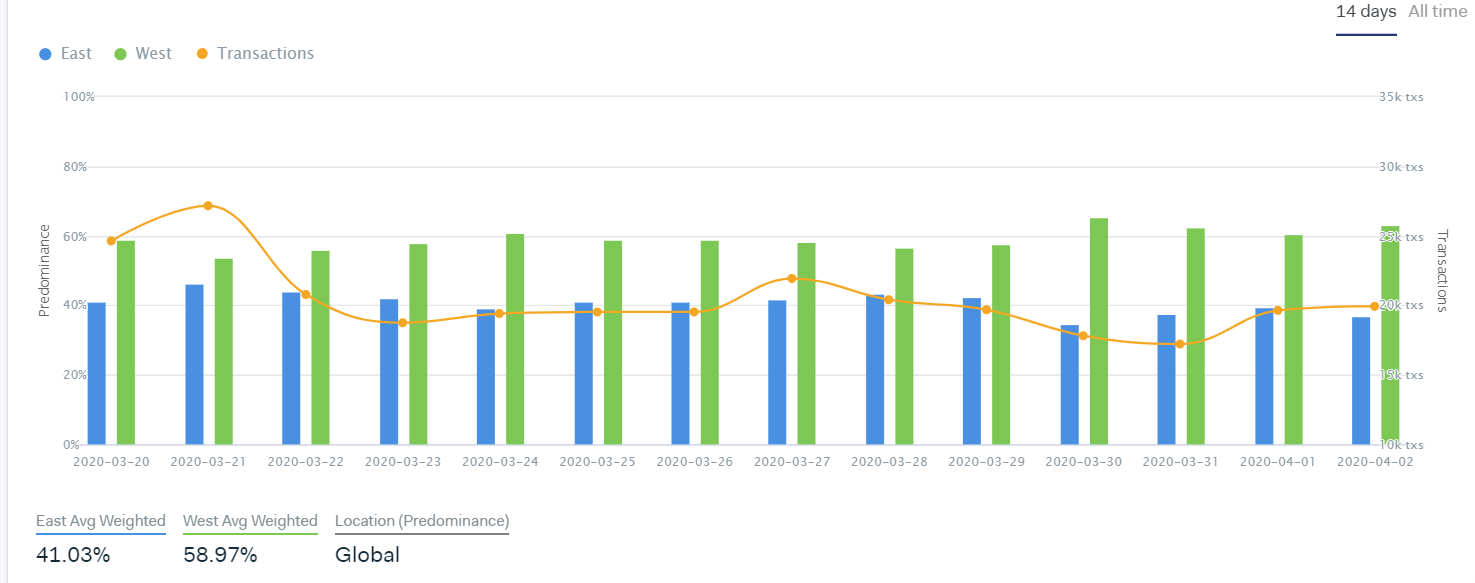
Metrics revealed by IntoTheBlock´s East-West analysis show that Dash is a worldwide traded token but with a higher activity of 58.97% predominance from the western hemisphere where the adoption seems to be faster. Dash is a highly distributed asset, as almost 84% of the holders are retail investors that own less than 0.1% of the circulating supply of tokens.
- There has been a recent spike in the UTXO Age Streams.
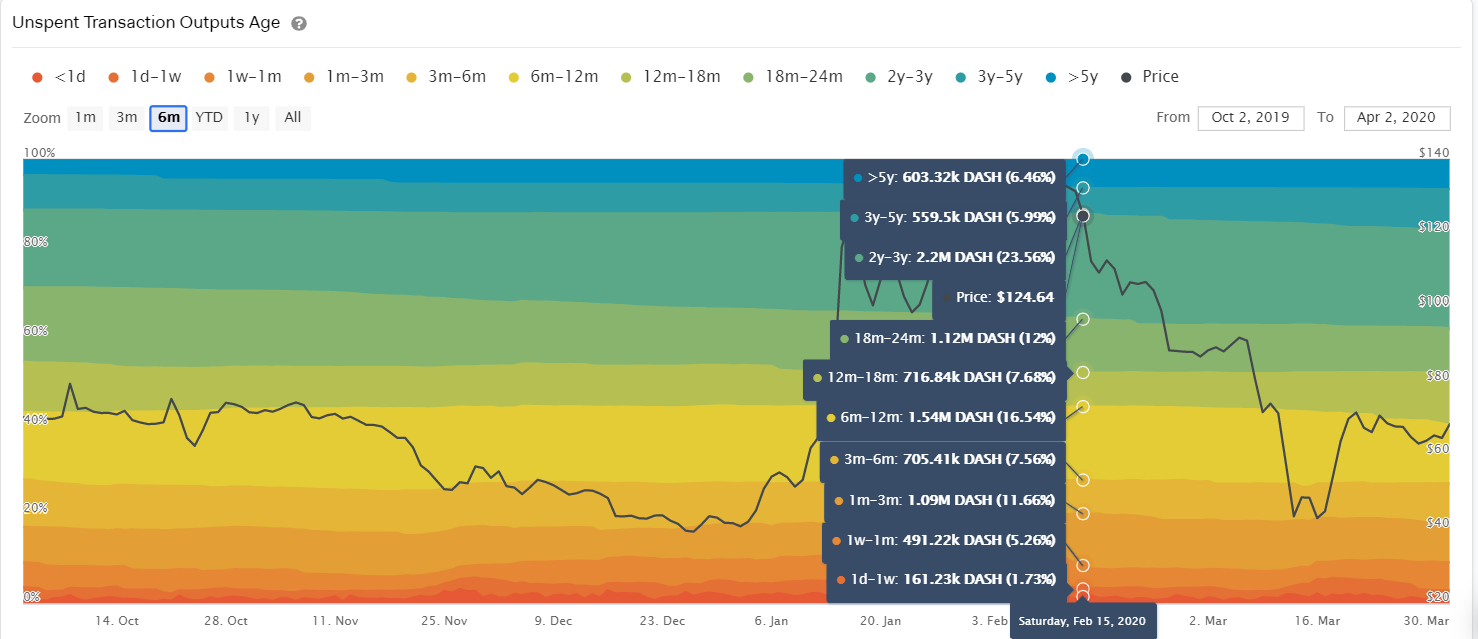
IntoTheBlock´s UTXO Age Stream graph shows a distribution of the different UTXO positions over time. We can see that for this asset, 23% of the tokens or 2.19 million Dash have been held for a period between 2 to 3 years being the most relevant group in the composition.
As Dash continues its evolution within the crypto market, some of these indicators show different views and perspectives to better understand and analyze the asset. Bear in mind that at IntoTheBlock we will keep looking for new and interesting patterns that are emerging.
Investment Disclaimer


