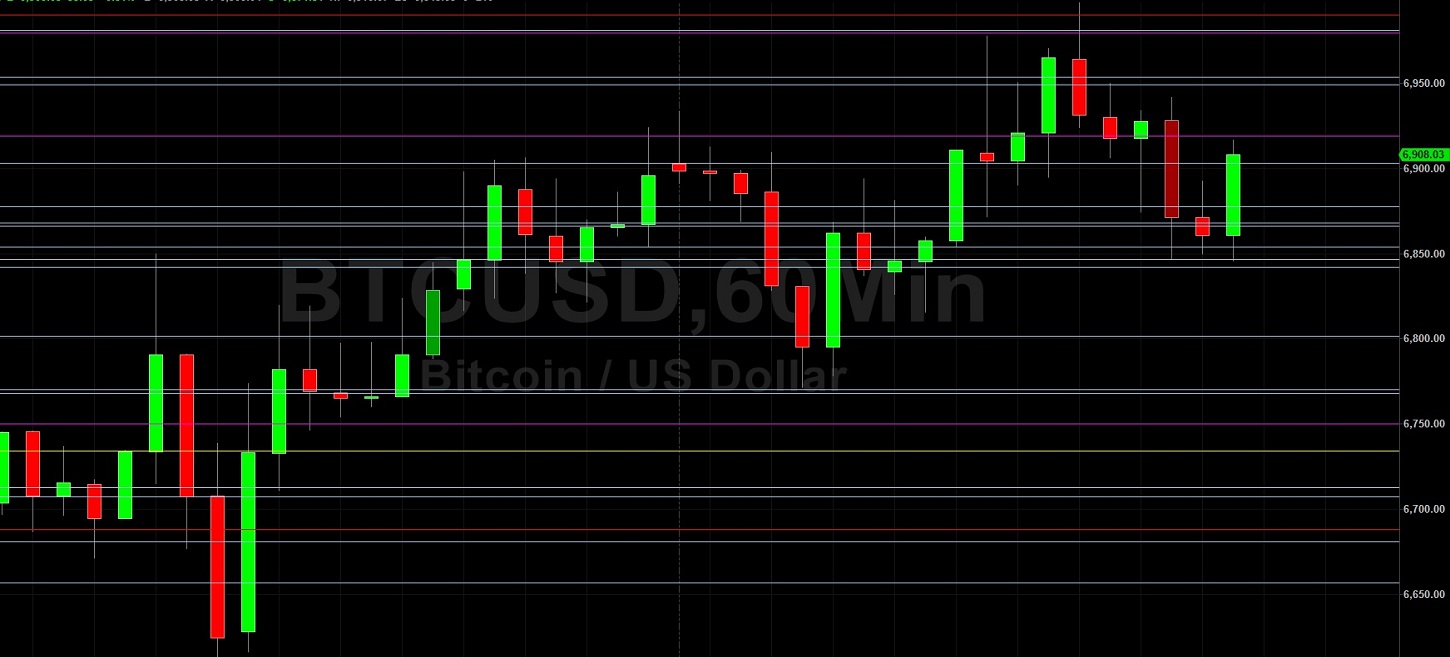
Bitcoin (BTC/USD) came off early in today’s Asian session as the pair weakened to the 6846.90 level after trading as high as the 6997.38 level during yesterday’s North American session. Some Stops were elected above the 6953.61 level during the move higher, an area that represents the 50% retracement of the recent depreciation from the 7200.00 area to the 6555.00 level. Chartists note that the pair stopped short of testing the 7010.50 area, representing the 50% retracement of the broader depreciation from 7466.00 to 6555.00. Traders are also looking to see if the pair can remain bid above the 6657.00 and 6467.26 levels, representing the 50% and 61.8% retracements of the appreciation from 5853.00 to 7461.00.
Above current price activity, upside price objectives include the 6903, 7010, 7118, and 7251 levels with some additional selling pressure again possible around the 7192 area. BTC/USD bulls continue to observe the 7411.18 area as an upside price objective, another area related to the 3858 low and one that was tested three times in early April. Below current price activity, downside price objectives include the 6572, 6481, 6403, 6383, 6291, and 6122 levels. Chartists are observing that the 50-bar MA (4-hourly) continues to bullishly indicate above the 100-bar MA (4-hourly) and 200-bar MA (4-hourly). Also, the 50-bar MA (hourly) continues to bearishly indicate below the 100-bar MA (hourly) and 200-bar MA (hourly), suggesting additional price depreciation in the short-term is likely.
Price activity is nearest the 100-bar MA (4-hourly) at 6820.04 and the 100-bar MA (Hourly) at 6865.73.
Technical Support is expected around 6481.88/ 6383.48/ 6250.85 with Stops expected below.
Technical Resistance is expected around 7430.00/ 7561.96/ 7716.85 with Stops expected above.
On 4-Hourly chart, SlowK is Bullishly above SlowD while MACD is Bullishly above MACDAverage.
On 60-minute chart, SlowK is Bearishly below SlowD while MACD is Bearishly below MACDAverage.