Bitcoin (BTC/USD) pared some strong gains early in today’s Asian session as the pair traded as high as the 7621.82 level after trading as high as the 7775.00 area during yesterday’s North American session, its strongest print since the pair’s acute depreciation in the first half of March. Significant Stops were elected above the 7497.49 level during the move higher, a downside price objective related to selling pressure that intensified around the 7986.48 level in the first half of March. Additional Stops were triggered above the 7584 and 7661 levels during the pair’s ascent, with more being elected above the 7751.67 area, an important downside price objective related to selling pressure that emerged around the 10522.51 level in mid-February. Some traders are again eyeing the 8000 figure as a psychologically-important upside price objective.
Above current price activity, upside price objectives include the 8032, 8162, 8258, and 8405 levels, areas related to downside selling pressure that emerged around February and March. Traders are very interested to see how the market reacts around the 7466 area, a level above which Stops were reached during yesterday’s North American session, and that represented a historical relative high dating to early April. Below current price activity, downside price objectives include the 6403, 6383, 6291, and 6122 levels. Chartists are observing that the 50-bar MA (4-hourly) bullishly moved above the 100-bar MA (4-hourly). Also, the 50-bar MA (hourly) has bullishly moved above the 100-bar MA (hourly), and continues to indicate above the 200-bar MA (hourly).
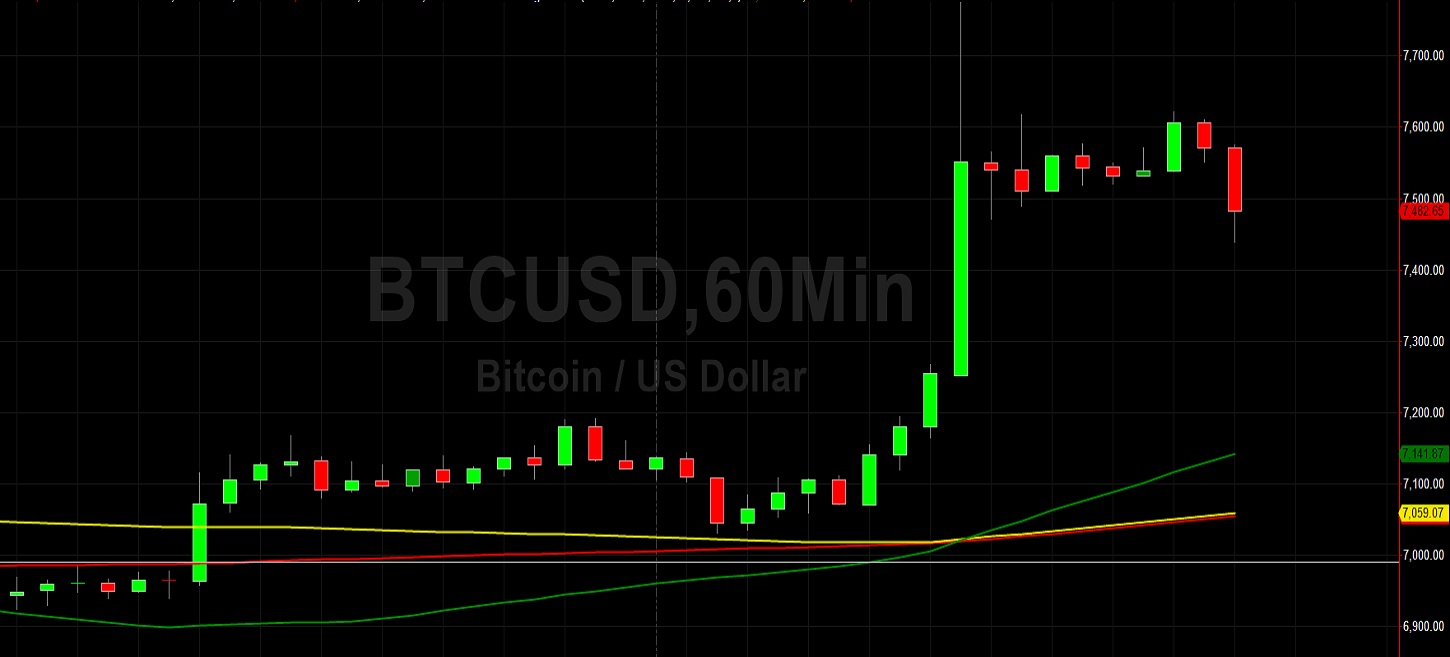
Price activity is nearest the 50-bar MA (4-hourly) at 7055.87 and the 50-bar MA (Hourly) at 7141.27.
Technical Support is expected around 6481.88/ 6383.48/ 6250.85 with Stops expected below.
Technical Resistance is expected around 8258.59/ 8405.58/ 8484.22 with Stops expected above.
On 4-Hourly chart, SlowK is Bearishly below SlowD while MACD is Bullishly above MACDAverage.
On 60-minute chart, SlowK is Bearishly below SlowD while MACD is Bullishly above MACDAverage.