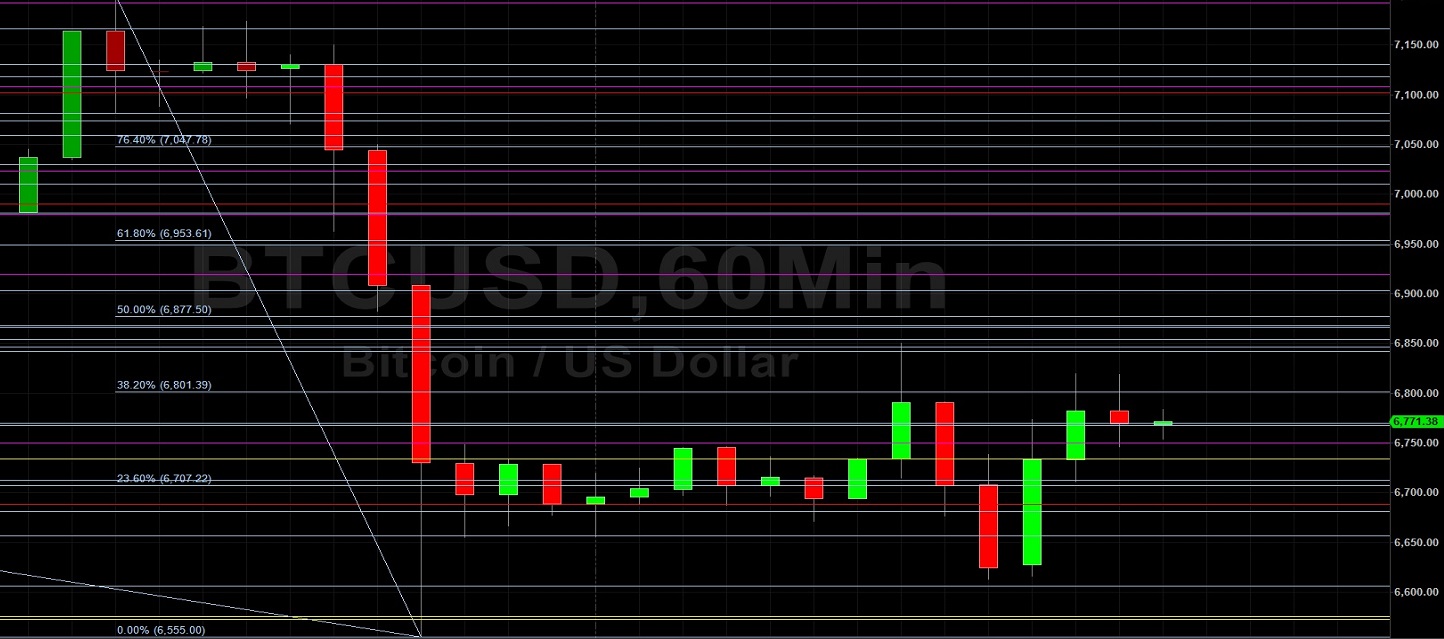
Bitcoin (BTC/USD) continued its volatile trading activity early in today’s Asian session as the pair continued to make moves below the psychologically-important 7000 figure, following the sharp move lower from the 7200 area that commenced during yesterday’s North American session. Some minor Stops were elected above the 7192.49 area during the pair’s ascent during yesterday’s North American session, a level that represents the 61.8% retracement of the depreciation from 7466.00 to 6750.00. BTC/USD then traded as low as the 6555.00 area after Stops were elected below the 6572.63 area, an upside price objective related to price activity that emerged around March’s low of 3858.00.
Above current price activity, upside price objectives include the 6903, 7010, 7118, and 7251 levels with some additional selling pressure again possible around the 7192 area. BTC/USD bulls continue to observe the 7411.18 area as an upside price objective, another area related to the 3858 low and one that was tested three times in early April. Below current price activity, downside price objectives include the 6572, 6481, 6403, 6383, 6291, and 6122 levels. Chartists are observing that the 50-bar MA (4-hourly) continues to bullishly indicate above the 100-bar MA (4-hourly) and 200-bar MA (4-hourly). Also, the 50-bar MA (hourly) continues to bearishly indicate below the 100-bar MA (hourly) and 200-bar MA (hourly), suggesting additional price depreciation in the short-term is likely.
Price activity is nearest the 100-bar MA (4-hourly) at 6766.49 and the 50-bar MA (Hourly) at 6851.47.
Technical Support is expected around 6481.88/ 6383.48/ 6250.85 with Stops expected below.
Technical Resistance is expected around 7430.00/ 7561.96/ 7716.85 with Stops expected above.
On 4-Hourly chart, SlowK is Bullishly above SlowD while MACD is Bearishly below MACDAverage.
On 60-minute chart, SlowK is Bullishly above SlowD while MACD is Bullishly above MACDAverage.