Bitcoin (BTC/USD) exhibited some volatility early in today’s Asian session as the pair traded as high as the 7200.00 level after searching for direction below the psychologically-important 7000 figure, and trading as low as the 6787.44 area during yesterday’s Asian session. A move higher during yesterday’s Asian session saw the pair reach the 6913.83 level before moving lower, an area that is right around the 23.6% retracement of the appreciation from 6750.00 to 6962.16. Also, a move higher during yesterday’s North American session saw the pair test the 6949.09 area, a level that represents the 50% retracement of the depreciation from 7292.11 to 6606.06. If BTC/USD is able to resume its recent upward trajectory, additional upside price objectives include the 7561, 7716, and 8103 areas, with some possible technical resistance expected around the 7023 and 7108 levels.
Additional Stops have recently been elected above the 6842 and 7059 levels, upside price objectives related to buying pressure last month around the 4432.30 area, and a related upside price objective is the 7870 level. Moreover, additional Stops were triggered above the 7234 area, an upside price objective related to buying activity around the 5001.00 area, and a related upside price objective is the 7761 area. Below current price activity, downside price objectives include the 6767, 6657, 6467, and 6232 levels. Chartists are observing that the 50-bar MA (hourly) has bearishly moved below the 200-bar MA (hourly), and that the 50-bar MA (4-hourly) bullishly remains above the 100-bar MA (4-hourly).
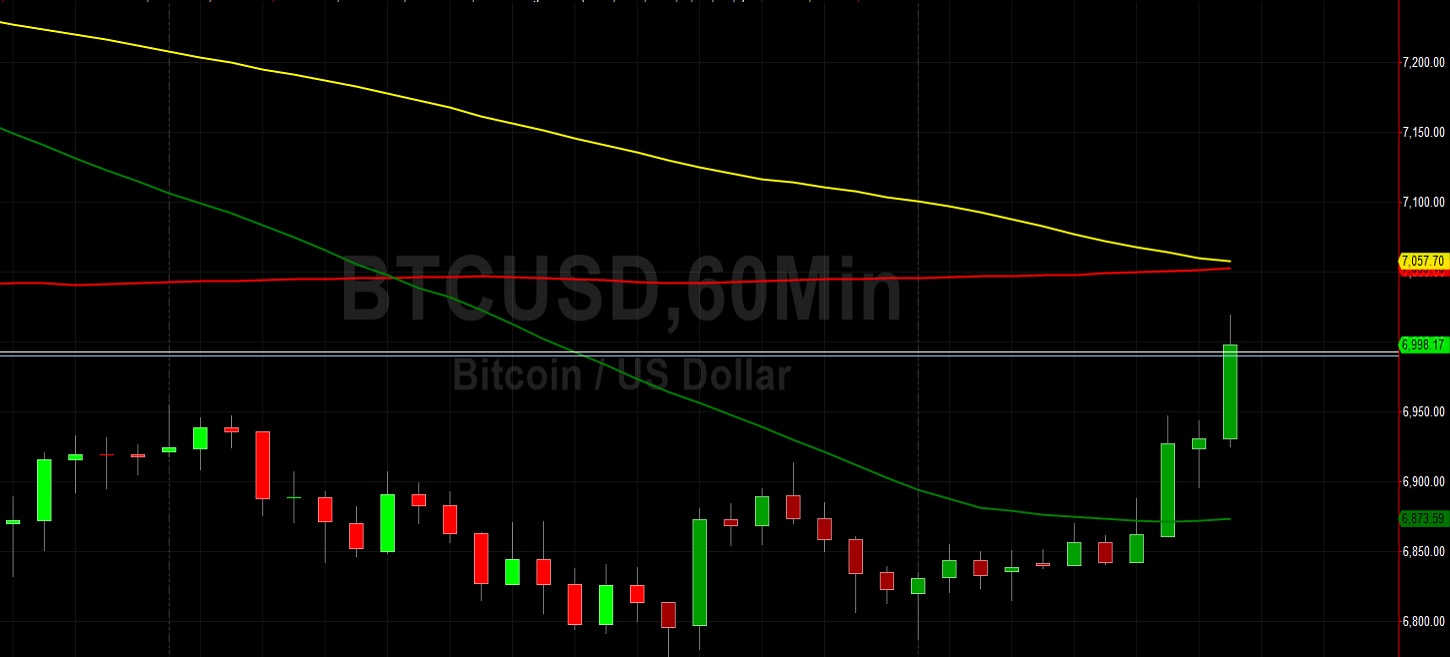
Price activity is nearest the 50-bar MA (4-hourly) at 7048.82 and the 50-bar MA (Hourly) at 6872.32.
Technical Support is expected around 6572.63/ 6481.88/ 6383.48 with Stops expected below.
Technical Resistance is expected around 7430.00/ 7561.96/ 7716.85 with Stops expected above.
On 4-Hourly chart, SlowK is Bearishly below SlowD while MACD is Bearishly below MACDAverage.
On 60-minute chart, SlowK is Bullishly above SlowD while MACD is Bullishly above MACDAverage.