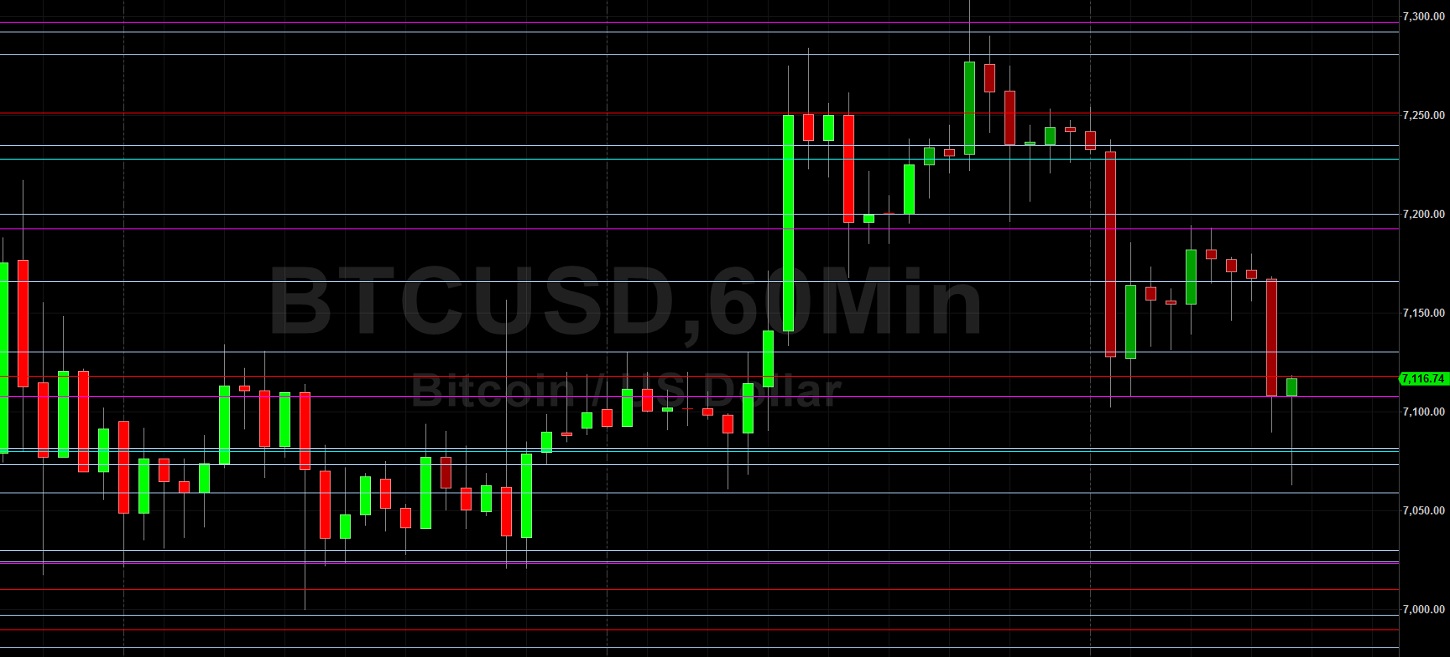
Bitcoin (BTC/USD) depreciated early in today’s Asian session as the pair moved back towards the psychologically-important 7000 figure after establishing a fresh multi-day high around the 7308.00 level during yesterday’s Asian session. Stops were elected above the 7289.55 level during the ascent, a downside price objective related to selling pressure from the 9214.66 area that developed in early March. Selling pressure emerged around the 7254.03 and 7194.17 levels during yesterday’s Asian and European sessions. Stops were earlier reached above the 7234.54 level during the ascent, an upside price objective related to buying pressure that originated around the 5001.00 area in mid-March. Last week, upward momentum emerged around the 6456.00 area, driving the price back above the psychologically-important 7000 figure. Notably, this buying pressure was right around the 6467.26 level that represents the 61.8% retracement of the appreciation from 5853.00 to 7461.00.
Above current price activity, upside price objectives include the 7414 and 7466 levels. BTC/USD bulls continue to observe the 7411.18 area as an upside price objective, another area related to the 3858 low and one that was tested three times in early April. Some traders are anticipating some Stops above the 7466 area, a recent relative high that could propel BTC/USD higher to the 7561.96 area if it is crossed. Below current price activity, downside price objectives include the 6403, 6383, 6291, and 6122 levels. Chartists are observing that the 50-bar MA (4-hourly) just bearishly crossed below the 100-bar MA (4-hourly). Also, the 50-bar MA (hourly) just bullishly crossed above the 200-bar MA (hourly), and continues to indicate above the 100-bar MA (hourly).
Price activity is nearest the 100-bar MA (4-hourly) at 6995.25 and the 50-bar MA (Hourly) at 7143.23.
Technical Support is expected around 6481.88/ 6383.48/ 6250.85 with Stops expected below.
Technical Resistance is expected around 7430.00/ 7561.96/ 7716.85 with Stops expected above.
On 4-Hourly chart, SlowK is Bearishly below SlowD while MACD is Bearishly below MACDAverage.
On 60-minute chart, SlowK is Bearishly below SlowD while MACD is Bearishly below MACDAverage.