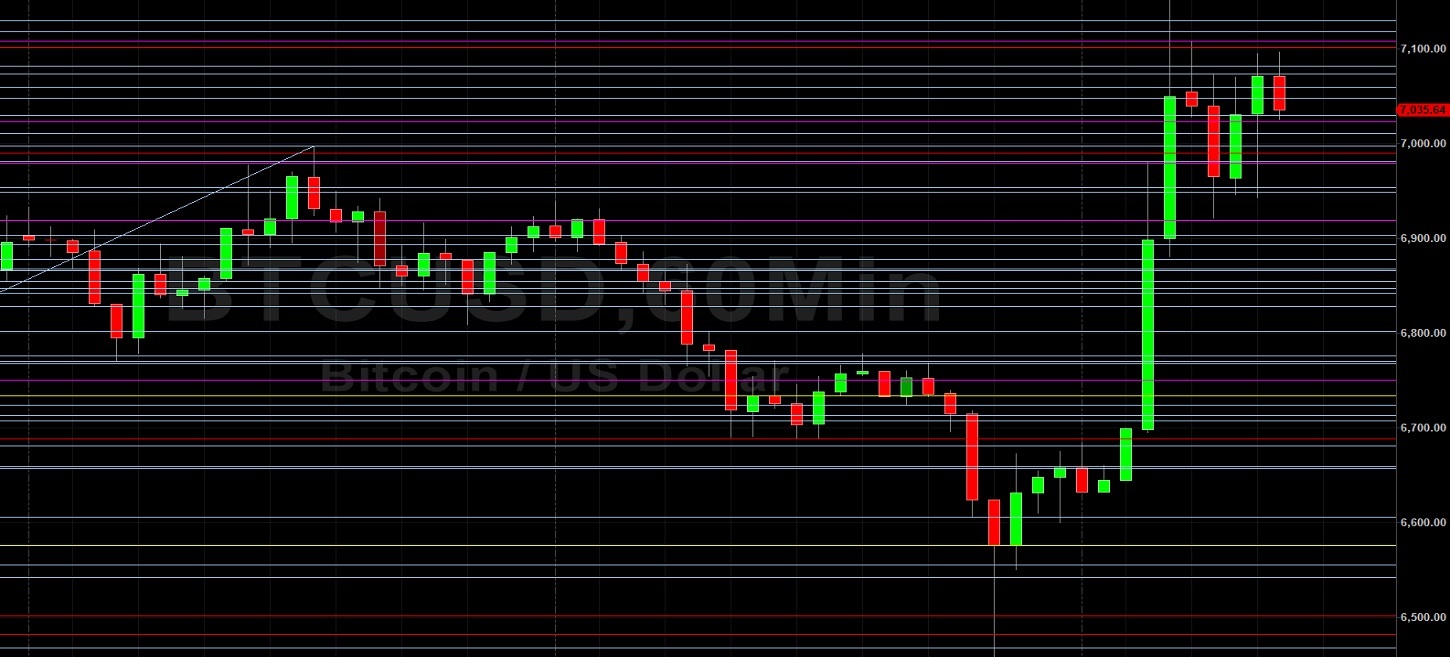
Bitcoin (BTC/USD) awaiting new market sentiment early in today’s Asian session as the pair continued to orbit the psychologically-important 7000 figure after peaking around the 7153.00 area during yesterday’s European session. This followed a sharp move higher that commenced during yesterday’s Asian session with acute selling driving BTC/USD lower from the 6768.84 area to the 6456.00 area, its weakest level since 2 April when the pair climbed higher from the 6160.00 area. Notably, this buying pressure was right around the 6467.26 level that represents the 61.8% retracement of the appreciation from 5853.00 to 7461.00. Above current price activity, upside price objectives include the 7251, 7297, 7414, and 7466 levels with some additional selling pressure again possible around the 7192 area.
BTC/USD bulls continue to observe the 7411.18 area as an upside price objective, another area related to the 3858 low and one that was tested three times in early April. Some traders are anticipating some Stops above the 7466 area, a recent relative high that could propel BTC/USD higher to the 7561.96 area if it is crossed. Below current price activity, downside price objectives include the 6403, 6383, 6291, and 6122 levels. Chartists are observing that the 50-bar MA (4-hourly) continues to bullishly indicate above the 100-bar MA (4-hourly) and 200-bar MA (4-hourly). Also, the 50-bar MA (hourly) continues to bearishly indicate below the 100-bar MA (hourly) and 200-bar MA (hourly), suggesting additional price depreciation in the short-term may be likely.
Price activity is nearest the 50-bar MA (4-hourly) at 6951.09 and the 200-bar MA (Hourly) at 6959.49.
Technical Support is expected around 6481.88/ 6383.48/ 6250.85 with Stops expected below.
Technical Resistance is expected around 7430.00/ 7561.96/ 7716.85 with Stops expected above.
On 4-Hourly chart, SlowK is Bullishly above SlowD while MACD is Bullishly above MACDAverage.
On 60-minute chart, SlowK is Bullishly above SlowD while MACD is Bullishly above MACDAverage.