Bitcoin (BTC/USD) looked to be on the defensive early in today’s Asian session as the pair continued to orbit the 7500 level after trading as low as the 7390.00 area during yesterday’s European session. Notably, this level was just below the 7403.07 area, representing the 50% retracement of the recent appreciation from 7031.14 to 7775.00. If additional short-term weakness develops, traders will carefully monitor price behaviour around related areas of potential technical support, including the 7315.29 and 7206.69 levels. Notably, the low from yesterday’s European session was also just above the 7382.96 area, representing the 38.2% retracement of the appreciation from 6748.72 to 7775.00. Significant Stops were elected above the 7497.49, 7584, and 7661 levels level during the move higher this week. Some traders are again eyeing the 8000 figure as a psychologically-important upside price objective.
Above current price activity, upside price objectives include the 8032, 8162, 8258, and 8405 levels, areas related to downside selling pressure that emerged around February and March. Traders are very interested to see how the market reacts around the 7466 area, a level above which Stops were reached during yesterday’s North American session, and that represented a historical relative high dating to early April. Below current price activity, downside price objectives include the 6959, 6767, 6403, 6383, 6291, and 6122 levels. Chartists are observing that the 50-bar MA (4-hourly) bullishly moved above the 100-bar MA (4-hourly). Also, the 50-bar MA (hourly) has bullishly moved above the 100-bar MA (hourly), and continues to indicate above the 200-bar MA (hourly).
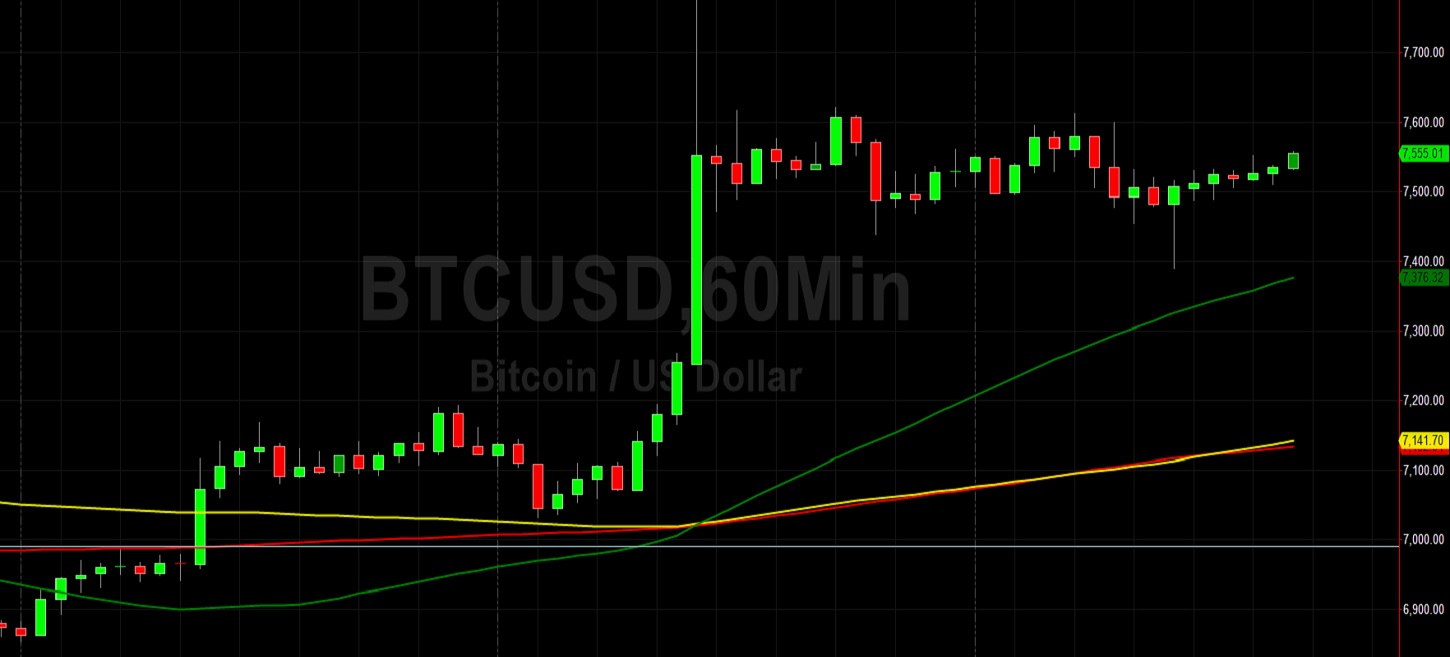
Price activity is nearest the 50-bar MA (4-hourly) at 7129.70 and the 50-bar MA (Hourly) at 7342.23.
Technical Support is expected around 6481.88/ 6383.48/ 6250.85 with Stops expected below.
Technical Resistance is expected around 8258.59/ 8405.58/ 8484.22 with Stops expected above.
On 4-Hourly chart, SlowK is Bearishly below SlowD while MACD is Bullishly above MACDAverage.
On 60-minute chart, SlowK is Bullishly above SlowD while MACD is Bearishly below MACDAverage.