Published
4 years ago on
March 09, 2020
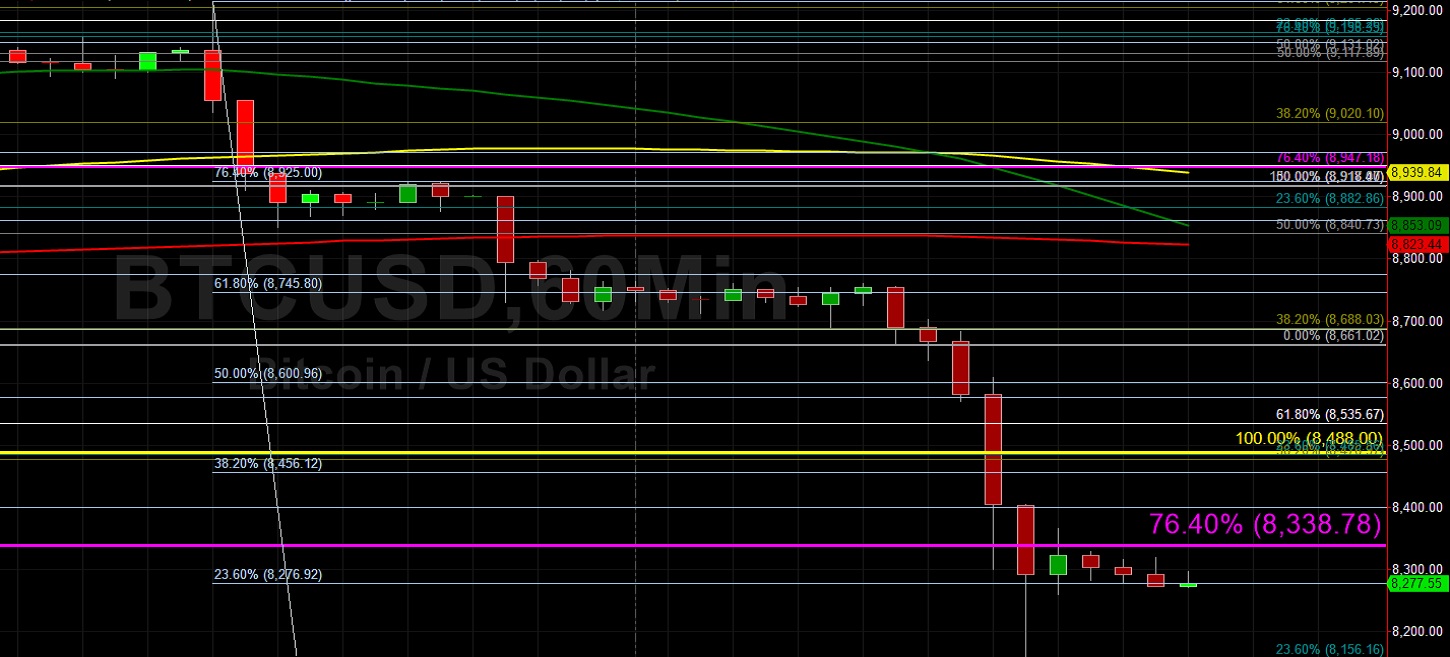
Bitcoin (BTC/USD) declined sharply early in today’s Asian session as the pair fell to the 8159.60 area after trading as high as the 8925.00 area during yesterday’s Asian session, an extension of the selling pressure that began around the 9214.67 level during Saturday’s North American session. Stops were elected below several technical levels during the pullback, including the 8635.31 and 8592.26 areas that represented upside price objectives related to buying pressure that commenced around the 8400.00 area. Additional Stops were triggered below downside price objectives related to selling pressure that arose around the 9214.67 area, and these levels included the 8456.12 and 8276.92 areas. Bids finally emerged to support the pair around the 8159.60 area, right around the 23.6% retracement of the move from 10939.34 to 7296.44.
The pair ascended above a multi-day trading range late last week after traders were able to push the pair above the 8973.45 level to the 9182.08 area, its strongest print in several days. Stops were elected above the 9117.19 level, a downside price objective related to the pair’s sell-off from the 10030 area that commenced on 24 February. This previous area of technical support became technical resistance, and the move above this area refocused traders on the 100-bar MA (4-hourly). The next upside levels related to the 10030 area include the 9291, 9465, and 9681 areas. Downside price objectives include the 7987.25, 7793.31, 7265.95, and 6613.45 levels.
Price activity is nearest the 50-bar MA (4-hourly) at 8812.91 and the 200-bar MA (Hourly) at 8825.30.
Technical Support is expected around 8062.04/ 7987.25/ 7793.31 with Stops expected below.
Technical Resistance is expected around 9121.40/ 9370.00/ 10534.04 with Stops expected above.
On 4-Hourly chart, SlowK is Bullishly above SlowD while MACD is Bearishly below MACDAverage.
On 60-minute chart, SlowK is Bearishly below SlowD while MACD is Bearishly below MACDAverage.
Ethereum (ETH/USD) weakened substantially early in today’s Asian session as the pair traded as low as the 203.00 area after trading as high as the 241.02 area during yesterday’s North American session. Prior to that, the pair peaked around the 253.01 area during Saturday’s North American session before beginning its acute sell-off. Previous upside price objectives related to the pair’s climb from the 211.50 area last week included the 226.69, 225.26, and 220.00 areas, and Stops were elected below these areas during the sharp depreciation.
Bids finally emerged around the 203.00 area early in today’s Asian session, right around the 50% retracement of the move from 116.25 to 290.00. Additional downside price objectives include the 195.34, 175.80, and 151.62 areas. Prior to this pullback, market sentiment started to improve around the middle of last week after the pair encountered buying pressure around the 211.50 level with additional bids emerging around the 220.00 level during the pair’s upside move. Stops were elected above the 233.76 and 239.02 areas during the pair’s ascent, both of which represent upside price objectives related to those areas where buying activity commenced.
Price activity is nearest the 50-bar MA (4-hourly) at 228.32 and the 200-bar MA (Hourly) at 228.63.
Technical Support is expected around 201.38/ 192.10/ 182.62 with Stops expected below.
Technical Resistance is expected around 221.60/ 227.60/ 233.60 with Stops expected above.
On 4-Hourly chart, SlowK is Bullishly above SlowD while MACD is Bearishly below MACDAverage.
On 60-minute chart, SlowK is Bearishly below SlowD while MACD is Bearishly below MACDAverage.
Investment Disclaimer