Published
4 years ago on
March 08, 2020
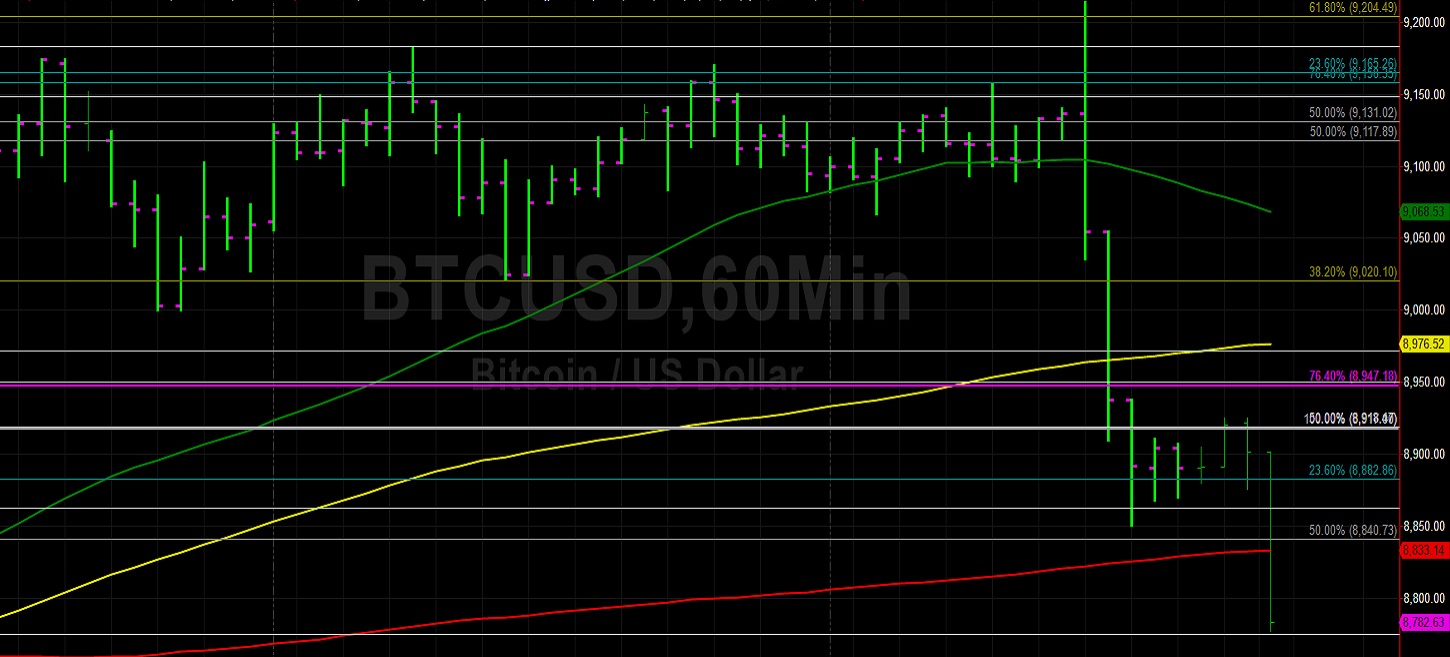
Bitcoin (BTC/USD) gave back some gains early in today’s Asian session as the pair traded as low as the 8850.47 area after trading as high as the 9214.67 level during yesterday’s North American session, an area that was just below the 38.2% retracement of the depreciation from 10522.51 to 8428.80. Stops were initially elected after the pair appreciated above the 100-bar MA (4-hourly), but those intraday gains could not be sustained and trading activity settled back to just above the 50-bar MA (4-hourly). The move higher during yesterday’s North American session also added to the pair’s gains above the 50-bar MA (hourly), but these quickly evaporated and the market moved back below the 100-bar MA (hourly), with some price support seen above the 200-bar MA (hourly).
Traders are monitoring some important technical levels to determine the pair’s next moves. First, the 8901.54 area represents a downside price objective related to selling pressure that intensified around the 10030.00 area, and traders are curious to see if it becomes technical support or technical resistance. Second, the 8922.92 area represents the 23.6% retracement of the depreciation from 10522.51 to 8248.80. Third, the 9161.77 area was an upside price objective related to the recent appreciation from the 8400.00 area, and it was tested and gave way multiple times over the past couple of days. Additional upside price objectives above this area include the 9372.81, 9397.08, and 9673.31 areas.
Price activity is nearest the 50-bar MA (4-hourly) at 8834.77 and the 200-bar MA (Hourly) at 8833.19.
Technical Support is expected around 8343.96/ 8062.25/ 7963.25 with Stops expected below.
Technical Resistance is expected around 9121.40/ 9370.00/ 10534.04 with Stops expected above.
On 4-Hourly chart, SlowK is Bearishly below SlowD while MACD is Bearishly below MACDAverage.
On 60-minute chart, SlowK is Bearishly below SlowD while MACD is Bearishly below MACDAverage.
Ethereum (ETH/USD) came off early in today’s Asian session as the pair traded as low as the 236.67 level after trading as high as the 253.01 area during yesterday’s North American session. Notably, the pair ran out of upside momentum just below the 253.45 level, a technical area that represents the 23.6% retracement of the appreciation from the 135.12 level to the 290.00 level. During the pair’s ascent over the past couple of days, traders tested and moved the market above some important technical levels including the 233.76, 236.08, 239.02, 243.68, 247.52, and 251.27 areas.
These levels that were breached during the recent price appreciation correspond to the market’s recent low around the 211.50 area. Additional upside price objectives related to these levels include the 260.67 and 275.86 areas, levels that were outside traders’ reach during the climb higher late last week. During the pair’s pullback throughout yesterday’s North American session and into today’s Asian session, the 100-bar MA (hourly) provided some technical support, but this level gave way. Following the recent selling pressure encountered around the 253.01 area, traders are eyeing downside price objectives around the 227.60, 221.60, 214.17, and 202.17 areas.
Price activity is nearest the 50-bar MA (4-hourly) at 229.07 and the 100-bar MA (Hourly) at 233.14.
Technical Support is expected around 209.25/ 203.25/ 192.10 with Stops expected below.
Technical Resistance is expected around 253.75/ 260.41/ 270.09 with Stops expected above.
On 4-Hourly chart, SlowK is Bearishly below SlowD while MACD is Bearishly below MACDAverage.
On 60-minute chart, SlowK is Bearishly below SlowD while MACD is Bearishly below MACDAverage.
Investment Disclaimer