Published
4 years ago on
March 03, 2020
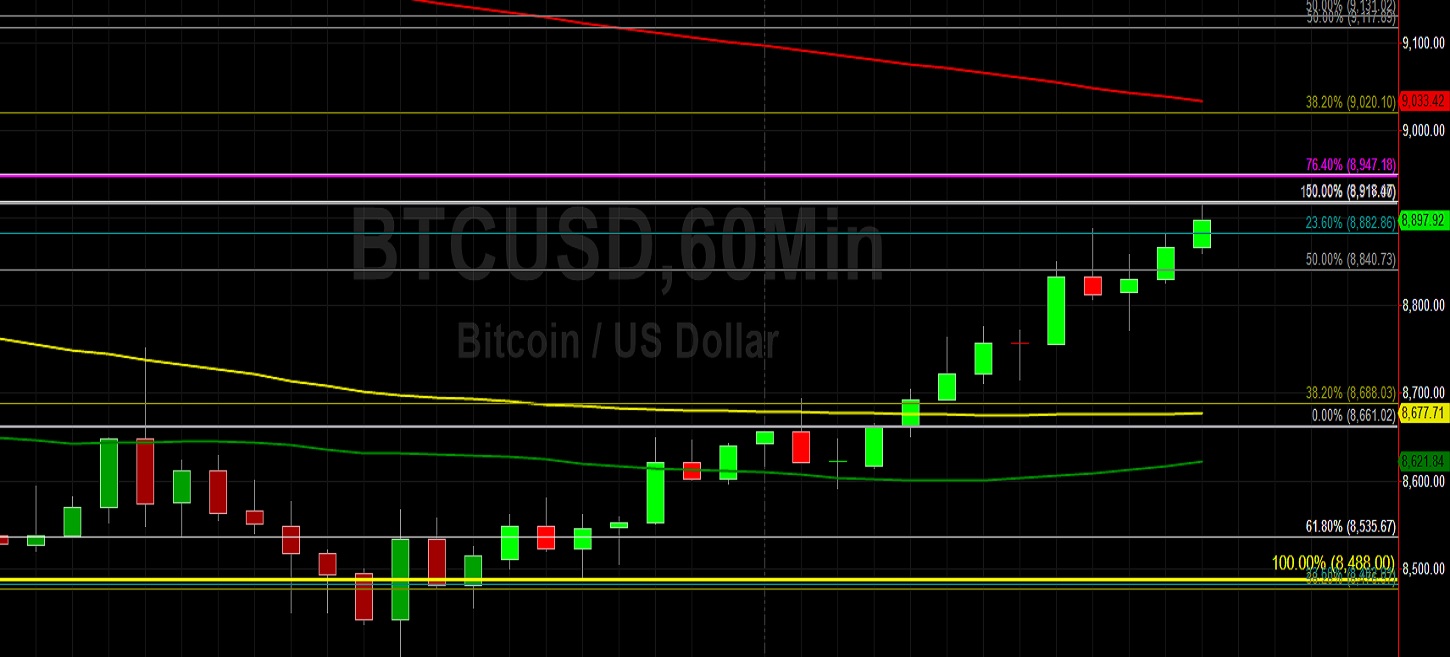
Bitcoin (BTC/USD) retraced some recent losses early in today’s Asian session as the pair traded as high as the 8973.45 area after bids emerged around the 8400.00 level during Sunday’s North American session. The pair appears poised to test the 50-bar MA (4-hourly), currently indicating below the 100-bar MA (4-hourly) and 200-bar MA (4-hourly). The pair’s 7.9% pullback during February has many traders evaluating and assessing the pair’s current trading activity, especially relative to historical movements and ranges. BTC/USD traded as low as the 8428.80 area on Friday, its lowest level since late January. Notably, this level was above the 8343.96 area, a level that represents the 76.4% retracement of the move from 7671.00 to 10522.51. Underscoring the range’s importance, Stops were elected below the 9096.76 and 8760.28 areas during last week’s sharp depreciation.
A broader range that traders are monitoring is the appreciation from the 6854.67 to 10522.51, and Stops were triggered below the 9656.80 and 9121.40 levels during the pullback, representing the 38.2% and 50% retracements of the appreciating range. The 8255.78 and 7720.28 areas represent the next downside retracement levels related to this range, and Stops are likely in place below. Moreover, traders are watching the broader 6430.00 – 10522.51 range. Sizable Stops were triggered below the 8959.17 area last week, representing the 38.2% retracement, and the range’s next downside retracement levels include the 8476.26 and 7993.34 areas. Additional downside areas of potential technical support include the 8298.90, 8229.45, 8062.25, and 7963.25 areas.
Price activity is nearest the 50-bar MA (4-hourly) at 9009.02 and the 200-bar MA (Hourly) at 9033.37.
Technical Support is expected around 8343.96/ 8062.25/ 7963.25 with Stops expected below.
Technical Resistance is expected around 9121.40/ 9370.00/ 10534.04 with Stops expected above.
On 4-Hourly chart, SlowK is Bullishly above SlowD while MACD is Bullishly above MACDAverage.
On 60-minute chart, SlowK is Bullishly above SlowD while MACD is Bullishly above MACDAverage.
Ethereum (ETH/USD) notched some gains early in today’s Asian session as the pair traded as high as the 234.50 level after trading as low as the 211.50 area during Sunday’s North American session. Traders pushed the pair back above the 50-bar MA (hourly) and 100-bar MA (hourly) during the pair’s ascent, and chartists note that the pair is poised to test the 200-bar MA (hourly). Despite the pair’s 23% gain in February, price activity sharply declined from the 278.13 level to the 209.26 level around the last week of the month, a push lower that saw the market trade at its weakest level since early February. The 209.26 level was reached after Stops were elected below the 209.75 area, an area that represents the 23.6% retracement of the move from 627.83 to 80.60.
Another broad range that traders are monitoring is the move from 116.25 in mid-December to the 290.00 area in mid-February. Stops were triggered below the 223.63 area during the move lower last week, a level that represents the 38.2% retracement of that range. The next downside retracement levels in this range include the 203.13 and 182.62 levels. Another important range is the appreciation from the 135.12 area to the 290.00 area and Stops were triggered below the 253.34 and 230.83 areas during the recent pullback, representing retracement levels. Areas of potential technical support include the 208.53, 206.25, 203.13, 194.28, 189.28, 186.46, and 184.29 levels.
Price activity is nearest the 200-bar MA (4-hourly) at 232.90 and the 200-bar MA (Hourly) at 237.70.
Technical Support is expected around 209.25/ 203.25/ 192.10 with Stops expected below.
Technical Resistance is expected around 253.75/ 260.41/ 270.09 with Stops expected above.
On 4-Hourly chart, SlowK is Bullishly above SlowD while MACD is Bullishly above MACDAverage.
On 60-minute chart, SlowK is Bullishly above SlowD while MACD is Bearishly below MACDAverage.
Investment Disclaimer