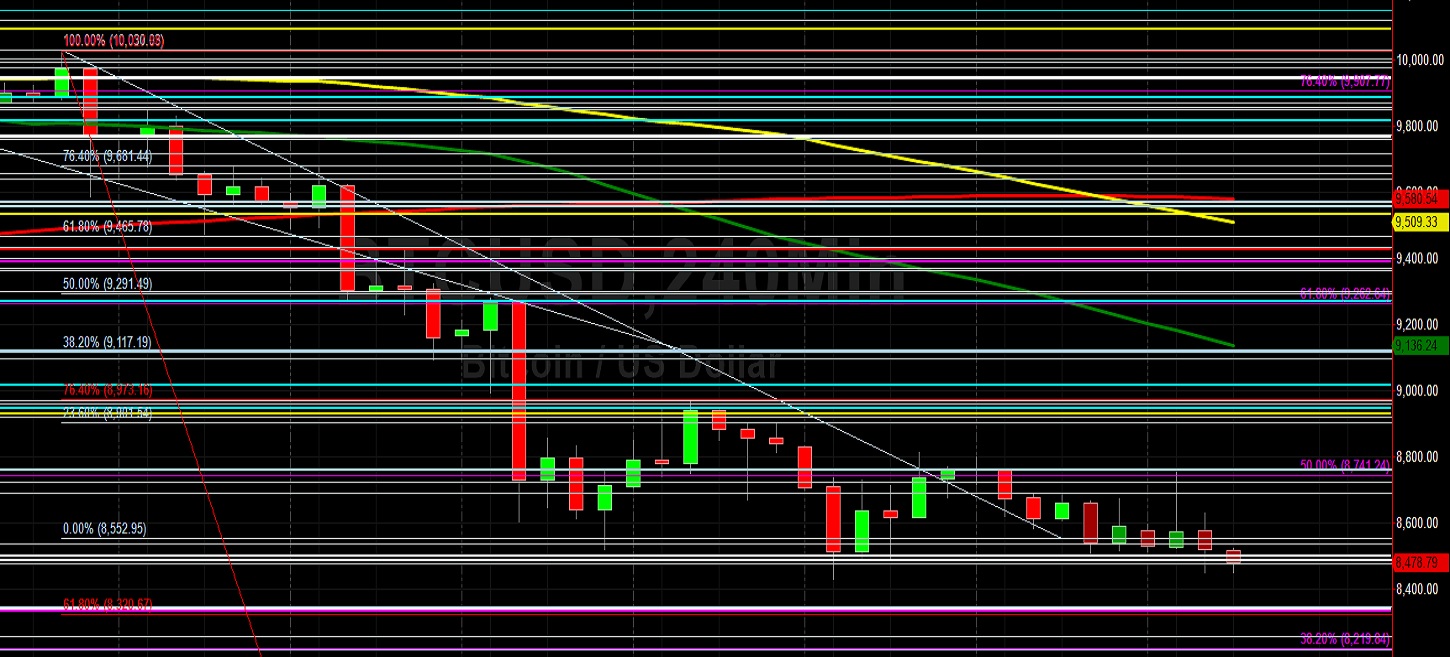
Bitcoin (BTC/USD) extended recent weakness early in today’s Asian session as the pair weakened to the 8473.20 level after trading as high as the 8752.34 area during yesterday’s European session. The 8813.12 level was the pair’s recent relative high, reached during Saturday’s Asian session, and the market has been pressured since then. Traders continue to speculate whether or not BTC/USD has reached a relative low following the significant selling pressure it has encountered since trading as high as the 10522.51 area on 13 February. Chartists and technicians had been focusing on the 8476.26 area, an important technical level that represents the 50% retracement of the move from 6430.00 to 10522.51, but this level was absorbed when price activity cratered to the 8428.80 area. If the recent depreciation is extended, some additional areas of downside technical support that traders are watching include the 8255.78, 7720.28, and 7305.83 areas.
Stops are cited below the 8216.71 and 7671.00 areas, with additional Stops expected below the 6854.67 levels. Price activity has recently traded been trading below the 50-bar MA (4-hourly), and the 200-bar MA (4-hourly) recently bearishly crossed above the 50-bar MA (4-hourly), suggesting some additional market weakness may be in store. Also, price activity has recently been trading below the 50-bar MA (hourly), a bearish development, and the 200-bar MA (hourly) is indicating above 200-bar MA (hourly) and 100-bar MA (hourly). Additional downside areas of potential technical support include the 8298.90, 8229.45, 8062.25, and 7963.25 areas.
Price activity is nearest the 50-bar MA (4-hourly) at 9136.22 and the 50-bar MA (Hourly) at 8636.04.
Technical Support is expected around 8343.96/ 8062.25/ 7963.25 with Stops expected below.
Technical Resistance is expected around 9121.40/ 9370.00/ 10534.04 with Stops expected above.
On 4-Hourly chart, SlowK is Bearishly below SlowD while MACD is Bullishly above MACDAverage.
On 60-minute chart, SlowK is Bearishly below SlowD while MACD is Bearishly below MACDAverage.
Ethereum (ETH/USD) extended its recent downturn early in today’s Asian session as the pair came off to the 214.66 level after trading as high as the 227.99 area during yesterday’s European session. The pair has been pressured lower from the 239.00 area since late last week. During the pair’s recent depreciation, the market shied away from testing the psychologically-important 300.00 figure and has drifted lower towards the psychologically-important 200.00 figure, trading as low as the 209.26 area. Notably, this level was just below the 209.75 area that represents the 23.6% retracement of the move from 627.83 to 80.60, a price area that has not traded since early February.
Areas of potential technical support include the 208.53, 206.25, and 203.13 levels. Price activity has recently been trading below the 200-bar MA (4-hourly), and 100-bar MA (4-hourly) recently bearishly crossed above the 50-bar MA (4-hourly). Likewise, price activity has recently traded below 50-bar MA (hourly), a bearish development, and 200-bar MA (hourly) has recently been indicating above the 100-bar MA (hourly) and 50-bar MA (hourly). Additional areas of potential technical support below the psychologically-important 200.00 figure include the 199.93, 197.25, 192.10, 186.73, 178.13, 175.00, and 170.00 levels.
Price activity is nearest the 200-bar MA (4-hourly) at 231.38 and the 50-bar MA (Hourly) at 224.01.
Technical Support is expected around 209.25/ 203.25/ 192.10 with Stops expected below.
Technical Resistance is expected around 253.75/ 260.41/ 270.09 with Stops expected above.
On 4-Hourly chart, SlowK is Bearishly below SlowD while MACD is Bullishly above MACDAverage.
On 60-minute chart, SlowK is Bearishly below SlowD while MACD is Bearishly below MACDAverage.