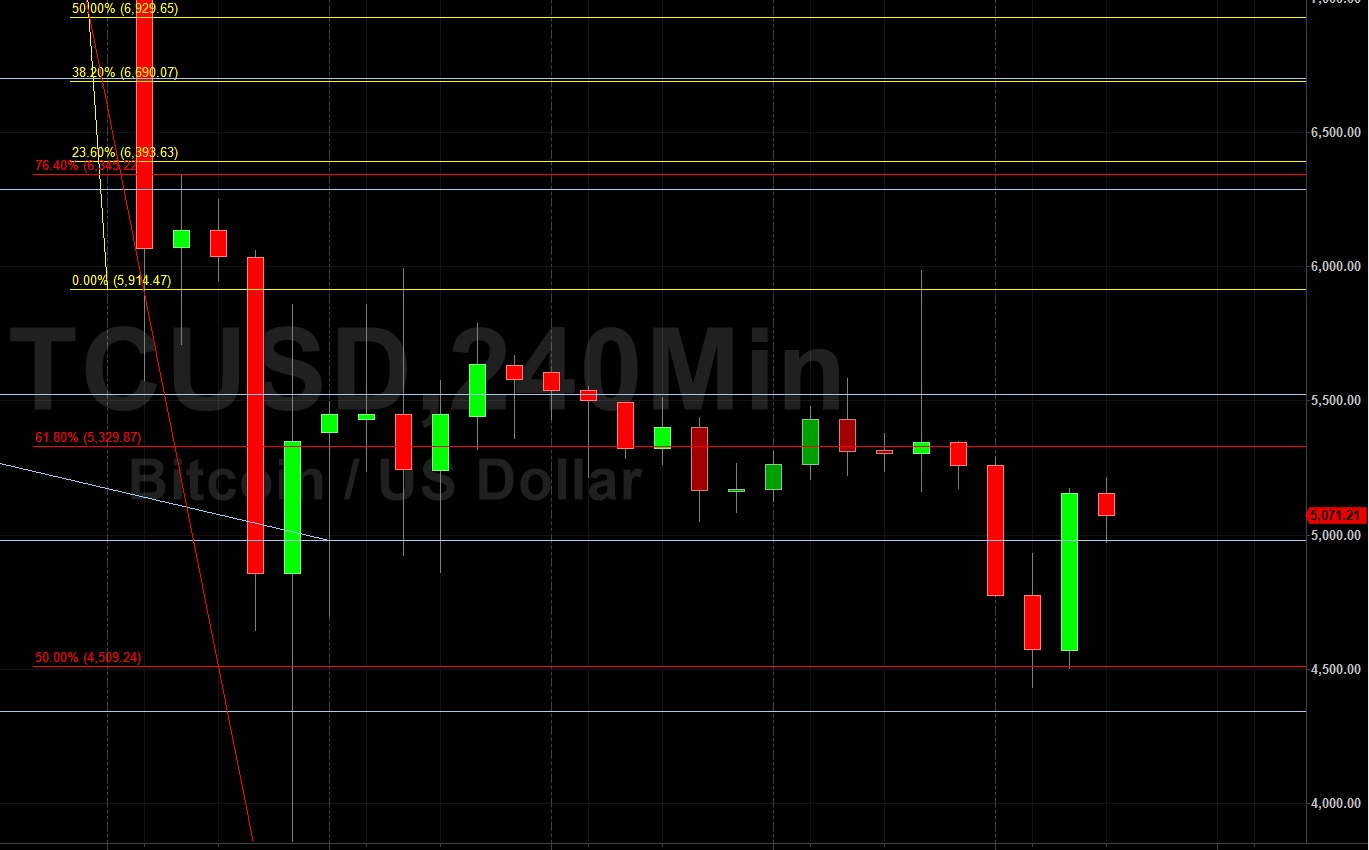
Bitcoin (BTC/USD) gained marginal ground early in today’s Asian session as the pair traded as high as the 5150.00 area after trading as low as the 4432.30 area during yesterday’s North American session. Stops were elected below the 4860.00 and 4696.55 levels during the move lower, both of which previously represented upside price objectives related to the pair’s recent climb from the 3858.00 area. The 5985.00 level represented an upside price objective related to buying activity that commenced around the 4860.00 area during Saturday’s Asian session. One range that traders are carefully monitoring is the appreciation from last week’s recent relative low around the 3858.00 area to the 5995.00 level. Buying pressure had earlier materialised at or just below the 4925.60 area, representing the 50% retracement of the appreciating range, and traders await indications the markets may move above or below this short-term range.
Following some of the pair’s recent technical resistance around the 5985.00 area, traders are closely eyeing the 3792, 3274, 2634, and 1599 levels as downside targets. Last week’s significant depreciation involved some of the most acute downward price activity ever experienced by BTC/USD traders. As traders decoupled from the risks associated with BTC/USD, a series of major Stops were elected below key price levels, and these price areas included the 7793, 7417, 7265, 6993, 6613, 6468, 6345, 5619, 5558, 5329, and 4509 levels. During the pair’s modest recovery, the pair as high gained ground to the 5885 level, came off to the 4696.55 area, gained ground to the 5995.00 level, and then fell back to the 4924.97 area before moderating. Below current market activity, traders are closely watching levels including the 4342, 3688, 2882, and 2673 levels. Stops are likely in place below these levels.
Price activity is nearest the 50-bar MA (4-hourly) at 6532.24 and the 50-bar MA (Hourly) at 5200.65.
Technical Support is expected around 4342.13/ 3688.61/ 2882.04 with Stops expected below.
Technical Resistance is expected around 5995.00/ 6345.00/ 6993.10 with Stops expected above.
On 4-Hourly chart, SlowK is Bearishly below SlowD while MACD is Bullishly above MACDAverage.
On 60-minute chart, SlowK is Bullishly above SlowD while MACD is Bearishly below MACDAverage.
Ethereum (ETH/USD) gained marginal ground early in today’s Asian session as the pair traded as high as the 115.65 area after finding buying demand around the 100.50 area during yesterday’s North American session. Stops were elected during multiple levels during the pullback lower from the 134.10 area during Monday’s Asian session. These levels included the 116.39, 111.69, 105.18, 103.40, and 101.76 areas. Traders are closely monitoring price activity relative to a recent range, namely the recent appreciation from the multi-month low around the 90.00 area and subsequent appreciation to the 148.00 area. The market had been supported around the 125.84 area for several trading sessions, representing the 38.2% retracement of the appreciating range. Prior to that, the market found some technical support around the 116.25 area, a very important technical level because it represented the previous recent relative low from late December.
Last week’s major sell-off saw ETH/USD experience one of its most dramatic sell-offs ever, a move that exacerbated the downturn from the 290.00 area that began in February. Traders exited long positions and decoupled from risk associated with ETH/USD and a series of major Stops were triggered during the crushing move lower at many levels. These price areas included the 177.39, 161.62, 154.03, 133.40, 130.67, 105.18, and 101.76 levels. Additional downside price objectives include the 111.69, 103.40, 95.66, 90.00, and 80.60 levels.
Price activity is nearest the 50-bar MA (4-hourly) at 158.83 and the 50-bar MA (Hourly) at 120.51.
Technical Support is expected around 100.15/ 95.66/ 80.60 with Stops expected below.
Technical Resistance is expected around 125.08/ 133.37/ 140.95 with Stops expected above.
On 4-Hourly chart, SlowK is Bearishly below SlowD while MACD is Bullishly above MACDAverage.
On 60-minute chart, SlowK is Bullishly above SlowD while MACD is Bullishly above MACDAverage.