Published
4 years ago on
March 13, 2020
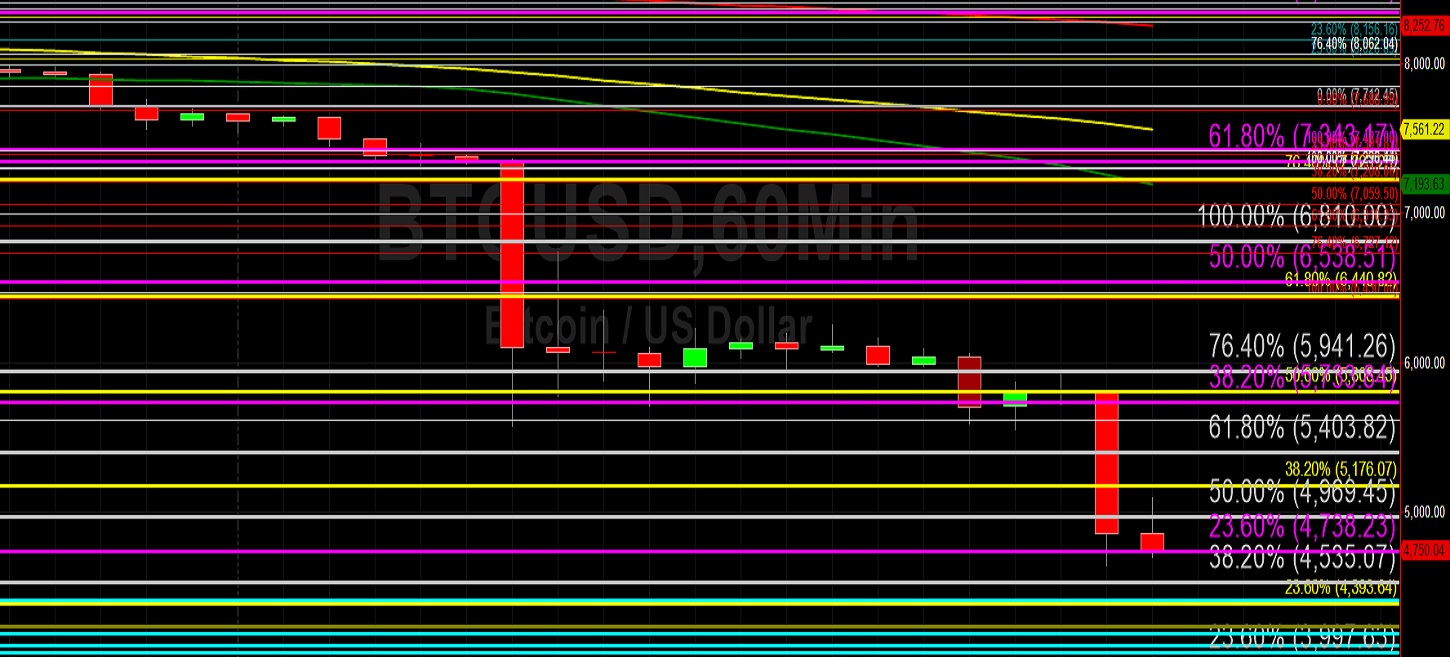
Bitcoin (BTC/USD) extended its seismic losses early in today’s Asian session as the pair traded as low as the 5555.65 area following a massive decline that commenced from the 7987.97 area during yesterday’s Asian session. Major Stops were elected during the severe downturn, including below the 7289.55 area, a downside price objective related to recent selling pressure from the 9214.66 area. Significant additional Stops were triggered below the 7097, 6702, 6287, and 5522 areas during the acute move lower. Traders continue to evaluate the ongoing volatility in price activity wondering where a price floor may emerge. This recent relative low was established after the pair abruptly declined from the 9214.67 area last week.
Traders are paying close attention to some important technical ranges including the appreciation from 3128.89 to 13868.44 where the 7231.40 area represents the 61.8% retracement and the 5663.42 level represents the 76.4% retracement. A much broader range is the decline from the 19891.99 area to 3128.89 area and the 7084.98 level represents the 23.6% retracement. Above current market levels, traders are monitoring areas such as the 8320.67, 8552.95, 8592.26, 8635.31, 8741.24, and 8901.53 levels to see if they become technical resistance. Below current market activity, traders were closely watching levels including the 7574.71, 7265.95, and 6613.45 areas, but price activity crashed through them and traders are now eyeing potential technical support around the 4342 area.
Price activity is nearest the 50-bar MA (4-hourly) at 8241.77 and the 50-bar MA (Hourly) at 7264.89.
Technical Support is expected around 4342.13/ 3997.63/ 2882.04 with Stops expected below.
Technical Resistance is expected around 6287.57/ 7751.48/ 8366.39 with Stops expected above.
On 4-Hourly chart, SlowK is Bearishly below SlowD while MACD is Bearishly below MACDAverage.
On 60-minute chart, SlowK is Bearishly below SlowD while MACD is Bearishly below MACDAverage.
Ethereum (ETH/USD) extended sharp losses early in today’s Asian session as the pair precipitously slumped to the 101.22 area after trading as low as the 196.58 area during yesterday’s North American session. Following the pair’s recent depreciation from the 253.01 level, traders are contemplating whether or not the pair will trade below the psychologically-important 100.00 figure for the first time since December 2018, or if the market will attempt to stabilise above that area. The market has since orbited the psychologically-important 200.00 figure and traded as high as the 206.28 area as traders continue to speculate whether positive market sentiment will propel price activity higher, or whether negative market sentiment will push price activity lower.
Some important technical ranges that traders are closely monitoring include the depreciation from the 199.50 area to the 116.25 area where the 135.90 level represents the 23.6% retracement. Likewise, the 141.76 area represents the 23.6% retracement of the move from 224.34 to 116.25 and the 132.90 area represents the 23.6% retracement of the depreciation from the 302.20 area to the 80.60 area. Downside price objectives that may serve as some technical support include the 95.66 and 80.60 levels.
Price activity is nearest the 50-bar MA (4-hourly) at 207.72 and the 50-bar MA (Hourly) at 173.62.
Technical Support is expected around 101.22/ 95.66/ 80.60 with Stops expected below.
Technical Resistance is expected around 122.75/ 132.90/ 152.11 with Stops expected above.
On 4-Hourly chart, SlowK is Bearishly below SlowD while MACD is Bearishly below MACDAverage.
On 60-minute chart, SlowK is Bullishly above SlowD while MACD is Bearishly below MACDAverage.
Investment Disclaimer