Bitcoin (BTC/USD) appreciated early in today’s Asian session as the pair traded as high as the 7987.97 area after trading as low as the 7583.27 area during yesterday’s North American session, just above the 23.6% retracement of the move from 10950.57 to 6531.91. The recent dramatic depreciation in the market has refocused attention on some longer-term trading ranges and the impacts that they could possibly have on price activity. The importance of many of these levels was reaffirmed during the depreciation in the second half of last year, and subsequent appreciation to multi-month highs over the past few months. One range that traders are paying close attention to is the appreciation from 3128.89 to 13868.44 where the 7231.40 area represents the 61.8% retracement and the 5663.42 level represents the 76.4% retracement.
Another range is the depreciation from 8488.00 to 3128.89 where the 76.4% retracement level is the 7223.25 area. A broader range that traders are carefully watching is the depreciation from 9948.12 to 3128.89 where the 61.8% retracement is the 7343.17 area and the 8338.78 level represents the 76.4% retracement. A much broader range is the decline from the 19891.99 area to 3128.89 area and the 7084.98 level represents the 23.6% retracement. Additional downside price objectives include the 7417.31, 7265.95, 6693.10, and 6613.45 areas.
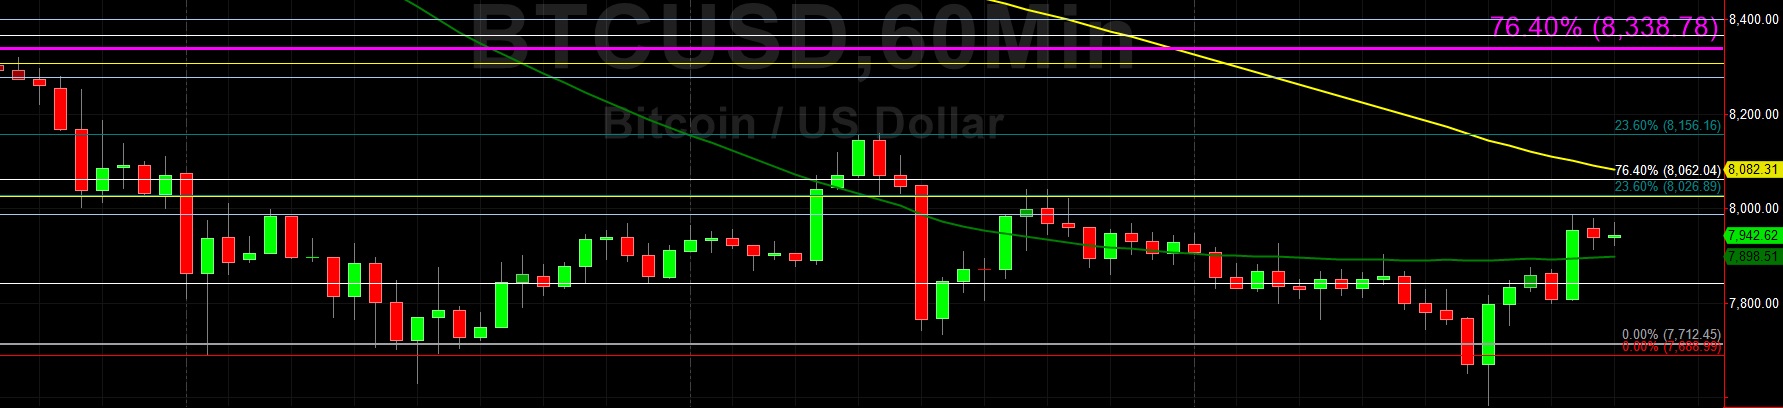
Price activity is nearest the 50-bar MA (4-hourly) at 8508.51 and the 50-bar MA (Hourly) at 7898.28.
Technical Support is expected around 7574.71/ 7265.95/ 6613.45 with Stops expected below.
Technical Resistance is expected around 8343.96/ 8592.95/ 8973.16 with Stops expected above.
On 4-Hourly chart, SlowK is Bullishly above SlowD while MACD is Bullishly above MACDAverage.
On 60-minute chart, SlowK is Bullishly above SlowD while MACD is Bullishly above MACDAverage.
Ethereum (ETH/USD) gained ground early in today’s Asian session as the pair traded as high as the 196.58 area after trading as low as the 181.00 level during yesterday’s North American session. The acute pullback over the past several days has increased volatility and also caused traders to contemplate how price activity will react around areas of potential technical support to the downside that are related to broader historical ranges. One such range is the depreciation from the 199.50 area to the 116.25 area where the 179.85 level represents the 76.4% retracement and the 167.70 area represents the 61.8% retracement.
A broader depreciating range is the move from the 239.35 area to the 116.25 area where the 177.85 level represents the 50% retracement and the 163.31 level represents the 38.2% retracement. Moreover, the 174.83 area represents the 23.6% retracement of the much broader depreciation from the 364.49 level to the 116.25 level. Notably, the 211.08 area is the 38.2% retracement of this range and traders will pay close attention to see how price activity reacts around this level when it next traders near it. A much broader range is the slump from the 547.57 level to the 80.60 level, and the 190.94 area represents the 23.6% retracement of this area. Downside price objectives include the 180.43, 170.76, and 167.17 areas.
Price activity is nearest the 50-bar MA (4-hourly) at 218.68 and the 50-bar MA (Hourly) at 198.73.
Technical Support is expected around 180.43/ 170.76/ 167.18 with Stops expected below.
Technical Resistance is expected around 204.00/ 206.28/ 209.25 with Stops expected above.
On 4-Hourly chart, SlowK is Bullishly above SlowD while MACD is Bullishly above MACDAverage.
On 60-minute chart, SlowK is Bullishly above SlowD while MACD is Bullishly above MACDAverage.