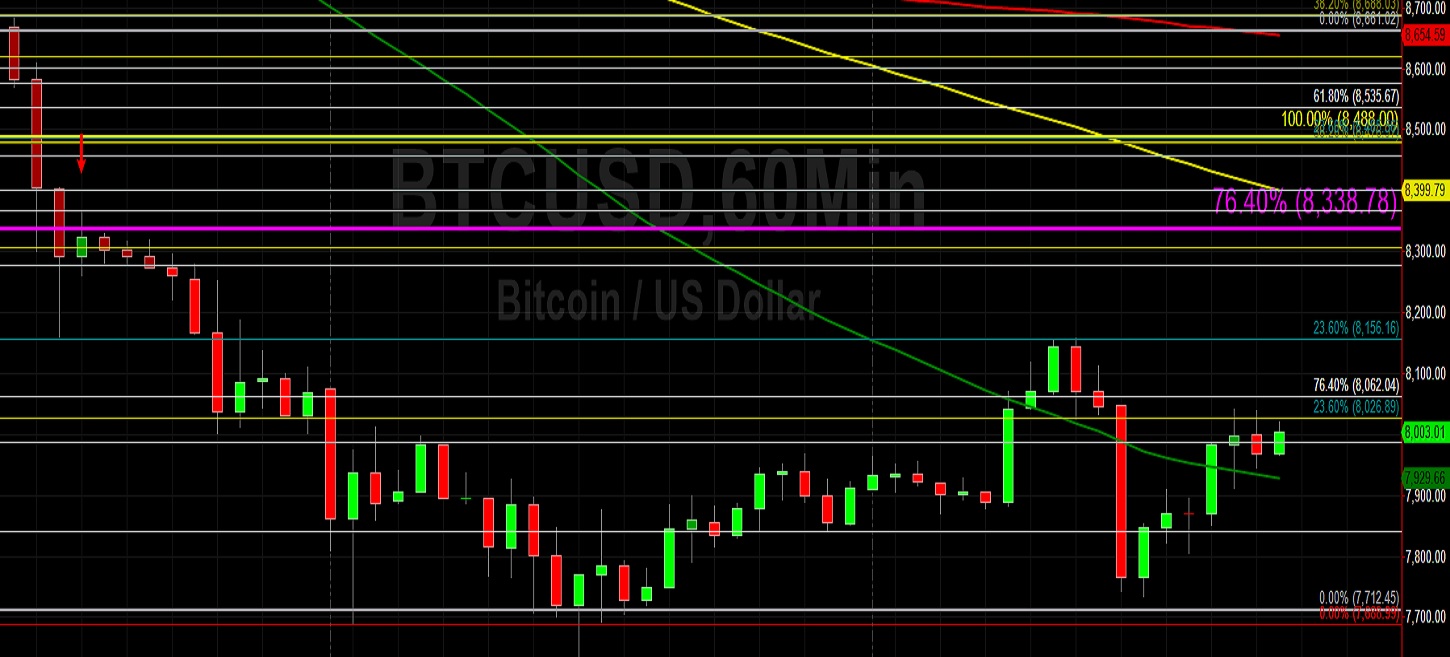
Bitcoin (BTC/USD) appreciated early in today’s Asian session as the pair traded as high as the 8040.64 area after finding demand around the 7733.56 area during yesterday’s North American session. The pair has recently traded as low as the 7630.00 area during Monday’s North American session. Market sentiment has shifted acutely during the past several trading sessions as the market steadily moved lower from the 10030 area, encountered buying pressure around the 8428.80 area, recovered to the 9214.67 area, and then moved sharply to the 7630.00 area. The abrupt changes in market direction have confused many traders and led to many trading biases becoming adjusted several times over the past couple of weeks. The late weekend collapse pushed BTC/USD lower to its weakest level since 14 January as traders increasingly mitigate their exposure to BTC in favour of USD.
Notably, BTC/USD moved higher to the 8158.25 area during yesterday’s North American session, a shallow retracement that was well below the 38.2% retracement of the depreciation from 9214.67 to 7630.00. The resurgence of BTC/USD weakness was hastened by the election of many Stops related to the downturn from the 10030 area and subsequent upturn from the 8400.00 area. Stops were triggered below the 8901.53, 8741.24, 8635.31, 8592.26, 8552.95, and 8320.67 levels during the depreciation lower. This sharp sell-off increased the likelihood of a move to test bids around the 7793.31, 7574.71, 7265.95, and 6613.45 areas. Another important technical level that traders are closely monitoring is the 7987.25 area.
Price activity is nearest the 50-bar MA (4-hourly) at 8639.32 and the 50-bar MA (Hourly) at 7934.74.
Technical Support is expected around 7630.00/ 7417.31/ 6993.10 with Stops expected below.
Technical Resistance is expected around 8366.39/ 8760.76/ 9121.40 with Stops expected above.
On 4-Hourly chart, SlowK is Bullishly above SlowD while MACD is Bullishly above MACDAverage.
On 60-minute chart, SlowK is Bullishly above SlowD while MACD is Bullishly above MACDAverage.
Ethereum (ETH/USD) moved higher early in today’s Asian session as the pair gained ground to the 204.00 area after encountering upside price pressure from the 195.17 area during yesterday’s North American session. Many traders have been wrong-footed by ETH/USD’s recent trading activity, market-churning moves that saw a steady sell-off from the 278.15 level, recovery from the 209.26 area, climb to the 253.01 level, and then sharp depreciation to the 189.85 area. Market sentiment has become extremely challenging as a result, and the recent election of Stops above upside price objectives followed quickly by the election of Stops below downside price objectives have also contributed to short-lived technical trading activity.
ETH/USD moved higher to the 206.28 level during yesterday’s North American session, a shallow retracement higher that was well below the 38.2% retracement of the move from 253.01 to 189.85. Many Stops were triggered during this recent bout of elevated market volatility that drove ETH/USD to its weakest level since 6 February. Stops were reached below the 226.69, 225.26, 220.00, 214.17, 211.50, and 209.75 areas during the pair’s quick decline, and this acute depreciation opens up the 195.34 and 175.80 areas. ETH/USD bears are also eyeing the 151.62 level as a downside price objective, but before the market tests this area it would first need to get through some longer-term technical support levels including the 177.85, 174.83, 165.25, 163.31, and 157.30 areas.
Price activity is nearest the 50-bar MA (4-hourly) at 223.17 and the 50-bar MA (Hourly) at 201.40.
Technical Support is expected around 189.85/ 182.62/ 167.17 with Stops expected below.
Technical Resistance is expected around 209.75/ 221.60/ 227.60 with Stops expected above.
On 4-Hourly chart, SlowK is Bullishly above SlowD while MACD is Bearishly below MACDAverage.
On 60-minute chart, SlowK is Bullishly above SlowD while MACD is Bullishly above MACDAverage.