Looking at Ethereum from a Data-Driven Approach

Although last week was a total disaster for the overall market, Ether has been one of the best-performing assets of the year with a YTD return of 76.15%. The market dynamics of Ethereum have been strongly positive so far. As of today (March 5) ETH is trading at $232.77 USD with a market capitalization of $25.13 Billion dollars with a strong daily trading volume and consolidated as the second most important cryptocurrency after Bitcoin. The positive sentiment reached its peak on February 14th towards their 90 Day High mark of $285.54 USD, marking a remarkable performance for 2020.
As a leading crypto-asset, ETH has captured the attention of traders and analysts all over the world, being among the biggest gainers of this years’ bull run. The market has high expectations with the network upgrade as ETH 2.0 approaches later in the year with a transition from proof-of-work to proof-of-stake requiring miners to stake at least 32 ETH to operate.

There is an incredible amount of content and analysis covering Ethereum nowadays, but the intention for this section is to go deeper into the analysis of its performance using a data-driven approach through the IntoTheBlock platform, which leverages hundreds of factors to extract unique insights about the asset.
What Blockchain Data Tells Us About Eth
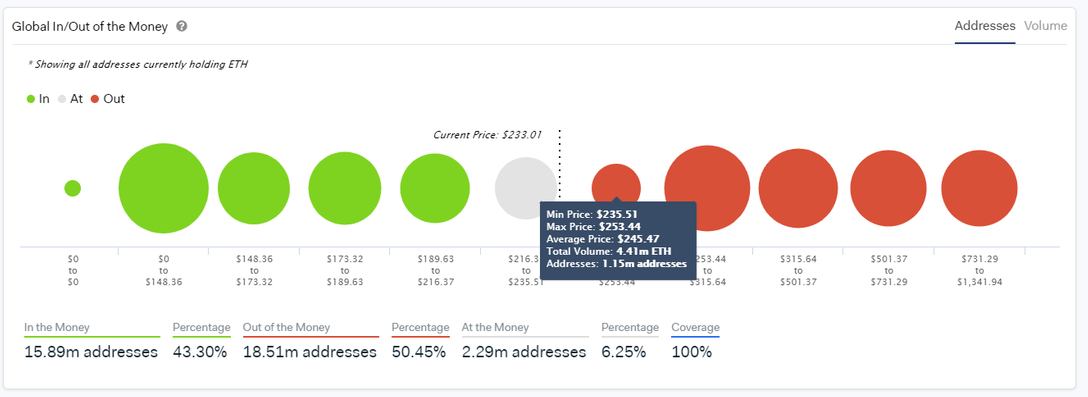
- Strong recovery for Ethereum Holders as 43.3% of them are In The Money right now.
IntoTheBlocks´s In-Out of the Money indicator reveals a holistic view of how this asset is doing in two different perspectives, by addresses, and by volume. For ETH, roughly 44% of addresses have a positive balance.
As the price went from $130 USD in early January towards $232 USD as of today, we can see how an important number of holders started recovering and making money on their investment. At the beginning of the year, almost 87% of ETH holders were underwater. Also, there is an important number of ETH holders who are currently At The Money (2.22 million addresses): this group can have an important effect on defining if the price will continue with a positive trend. It is important to consider that the Ethereum blockchain has over 1.15 million addresses with average positions between $123.50 and $253, which should represent a strong level of resistance.
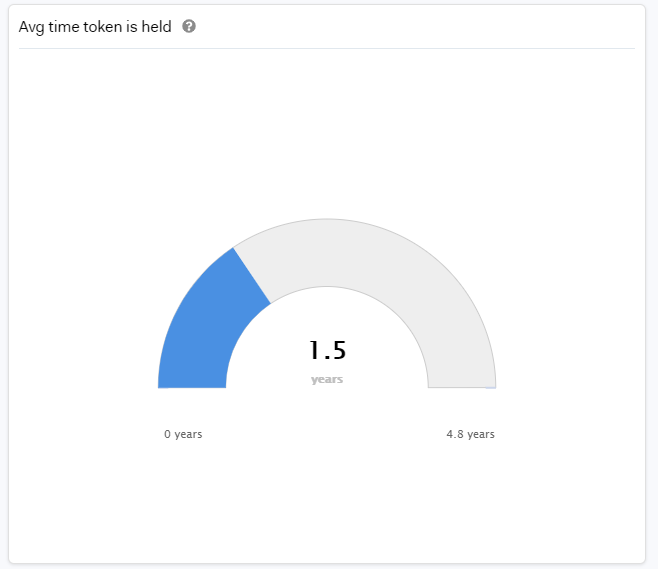
- Ethereum HODLER’s have been increasing over time
IntoTheBlock’s “Ownership by Time Held” analysis qualifies addresses based on their activity. The Hodlers indicator reveals the number of long term token holders (those that hold for more than 1 year). In the chart below, we can see how the number of long-time holders / passive investors is increasing on a monthly basis. This is usually interpreted as (i) a vote of confidence in the viability of the project, and (ii) that most ETH holders are still waiting on further price appreciation before selling.

Complementing this trend, it is important to note that the Average Time that Ethers stay on addresses before being transferred into other ones is 1.5 Years.
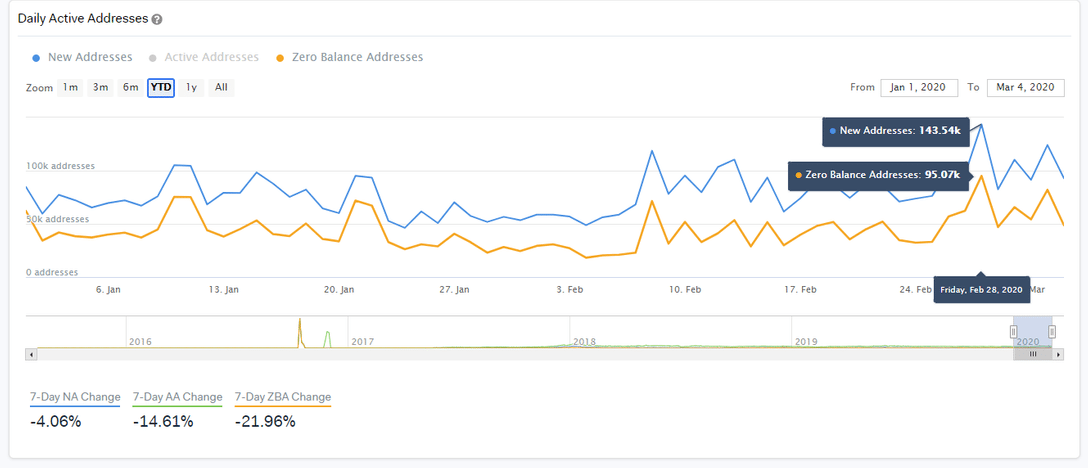
- The Ethereum Network is certainly active.
IntoTheBlock´s address analysis shows that in the past three months the number of New Addresses (blue line) has been higher than the number of Zero Balance Addresses (yellow line). Comparing these two numbers allows us to have visibility in terms of Net Network Growth, which we see as a positive figure while more users adopt ETH.
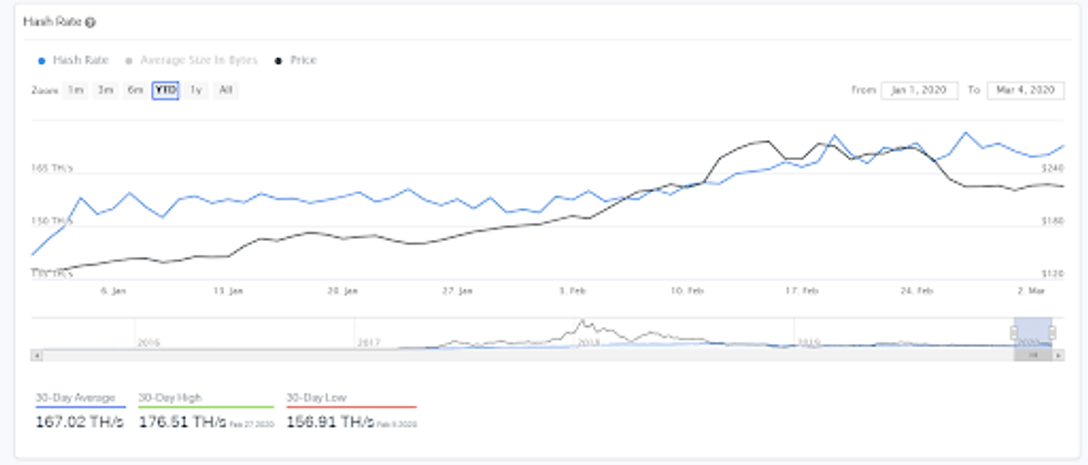
- Ether is attracting more miners over time.
IntoTheBlock’s new Hash Rate Indicator measures the speed (in computational power) at which the mining machines are validating blocks. The graph below shows how the hash rate has been increasing during the year. In January, the Hash Rate for Ethereum miners was 141.55 TH/s while just recently on February 27th reached its highest point at 176.51 TH/s.
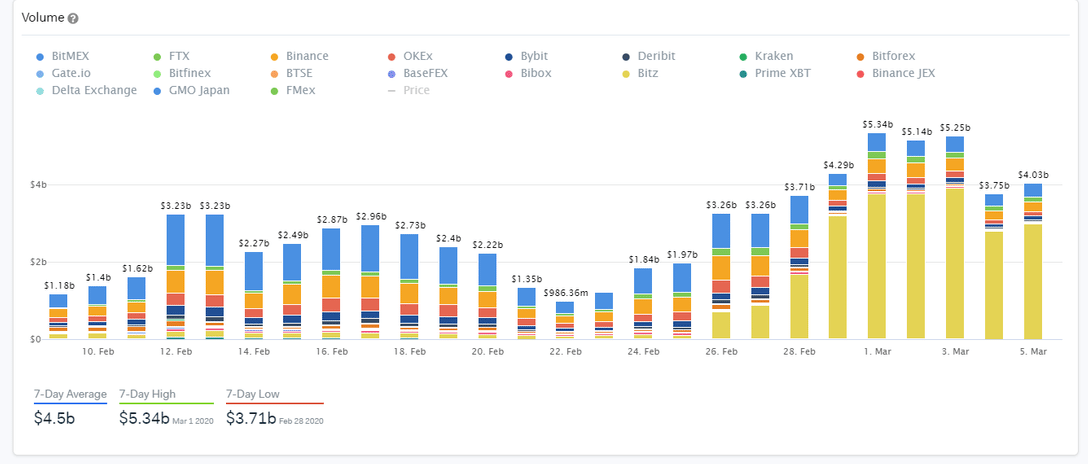
- Ethereum Derivatives and Futures is a fast-growing market.
Derivatives are certainly a hot topic in the market right now and one of the fastest growing segments in crypto. Specifically for Ethereum, we can see in the graph below how the total volume traded is increasing in the past couple of days, reaching a high of $5.34 Billion traded on March 1st.
As Ethereum continues its evolution within the crypto market, understanding changes in its fundamentals will be imperative for savvy investors. At IntoTheBlock, we are eager to foster our collaboration with CryptoDaily towards helping investors make more informed trading decisions.
