How “Buying the Dip” looks like from an on-chain standpoint?

Recent world events have had a profound impact on financial markets across all asset classes. On Monday, March 15, investors started the day with extremely rough conditions. So bad that we would have to look all the way back to 1987 where “Black Monday” took place to have a better context on the current market conditions. Billions have been wiped out as financial players sell and move their assets towards defensive positions and the crypto markets have been no exception.
Exactly a month ago before this whole crash exploited, Bitcoin’s price was trading around $9.6k with a Market Cap between $175bn - $180bn, and as time went by and the crisis worsened, we saw a massive decline that bottomed around USD $4,450. However, brighter times have come as we have been looking at a price rally that has Bitcoin trading towards the $6.5k mark today and recovering about 13% in the last 24 hours - just another regular day in the crypto space.

Consequently, in this article I would like to take advantage of the Pro subscription on the IntoTheBlock platform to look deeper into BTC and let the On-chain data explain what has recently happened and how investors might have “bought the dip”.
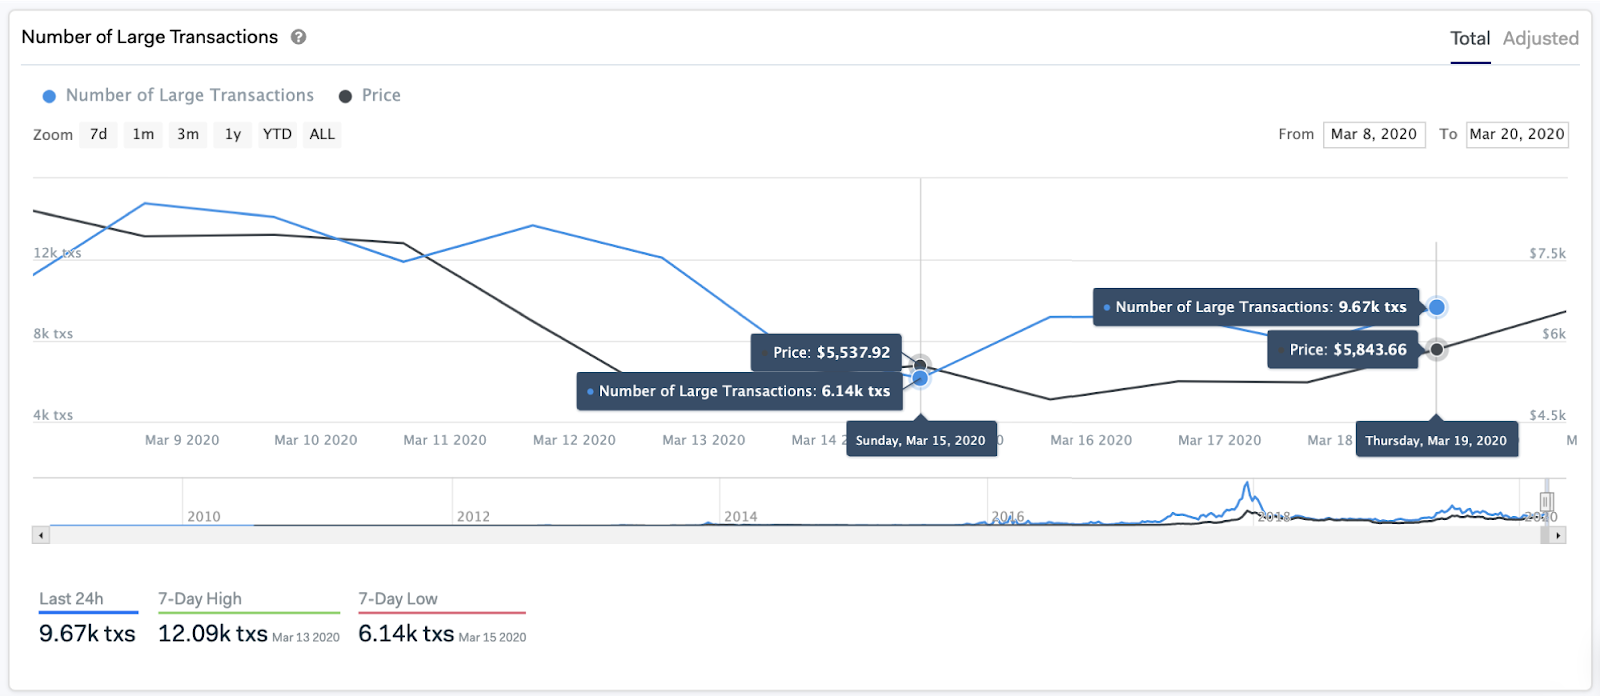
Number of Large Transactions are steadily increasing
Large Transactions (those with a value greater than USD $100k) are a good indication of price movement, as massive amounts of capital make their way in/out of Bitcoin, and into other crypto assets. Following the BTC price bottoming on March 13, Large Trxs kept decreasing until the 15th, where we have seen a steady climb of 57.5% since then. The volume traded in USD was significantly higher as well from $3.86bn to $6.39bn (or a 65% increase).
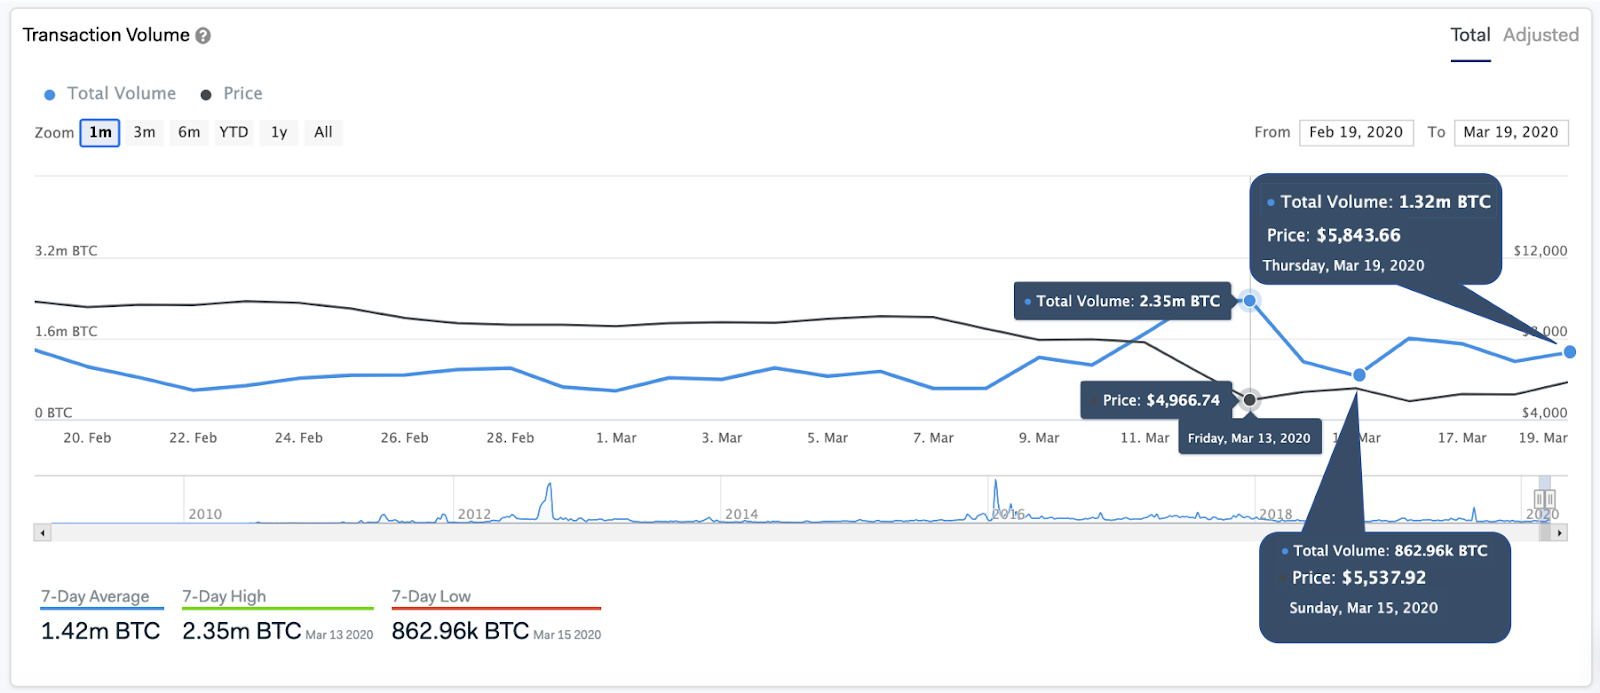
Total transacted volume rose significantly
Naturally, the Bitcoin network saw a roller coaster with heavy movement on both directions on transacted On-chain volume whilst BTC price dropped on the 13th of March. However, over the last 5 days, the transacted volume has slowly recovered as investors went back to trade the asset.
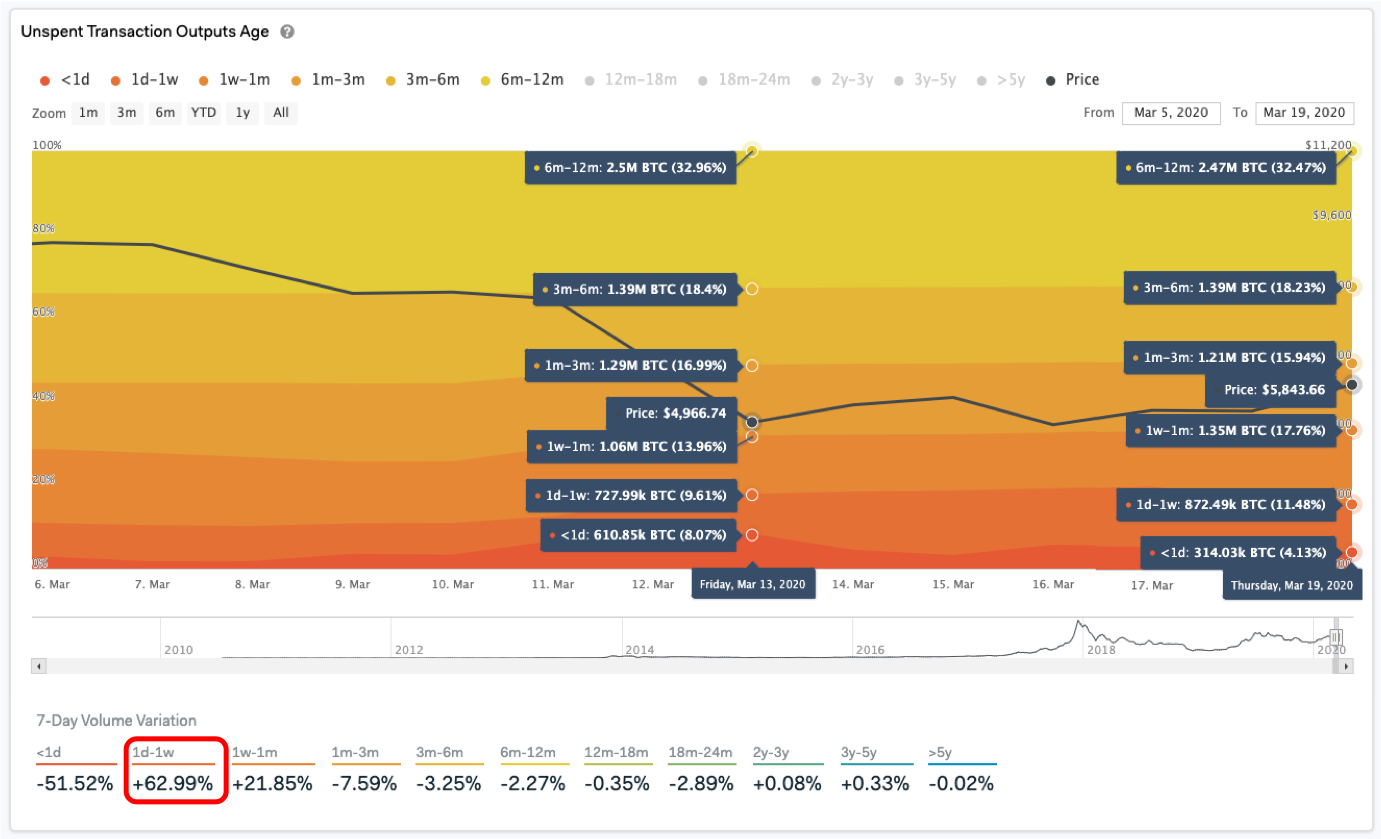
Over the last week, the percentage of newer Bitcoins has skyrocketed
IntoTheBlock’s UTXO analysis shows how new holdings of BTC have increased disproportionally (+63%), especially for the last week, supporting the “buying the dip” thesis since the price reached new lows on March 13.
Historical In/Out of the Money reveals interesting insights
The In/Out of the Money indicator from the IntoTheBlock platform has been one of the most popular amongst the extensive suite of analytics because it gives users a holistic view of how well investors on a specific crypto asset are doing. In addition, it can be used to reveal other interesting characteristics when you dive deep into the historical behavior of In the Money, At the Money, and Out of the Money addresses over time.
Zooming into these last days and as investors rushed to sell their assets, we can observe that for those that stayed in, meaning the “Out of the Money” addresses, reached new highs of around 60% - something we haven’t seen since the beginning of 2019. Contrarily, the percentage of addresses “At the Money” went from 12% on March 12 to 1% on the 13th. However, that same value surged back to 16% as the price climbed back, indicating potential new entries at low prices on March 16.
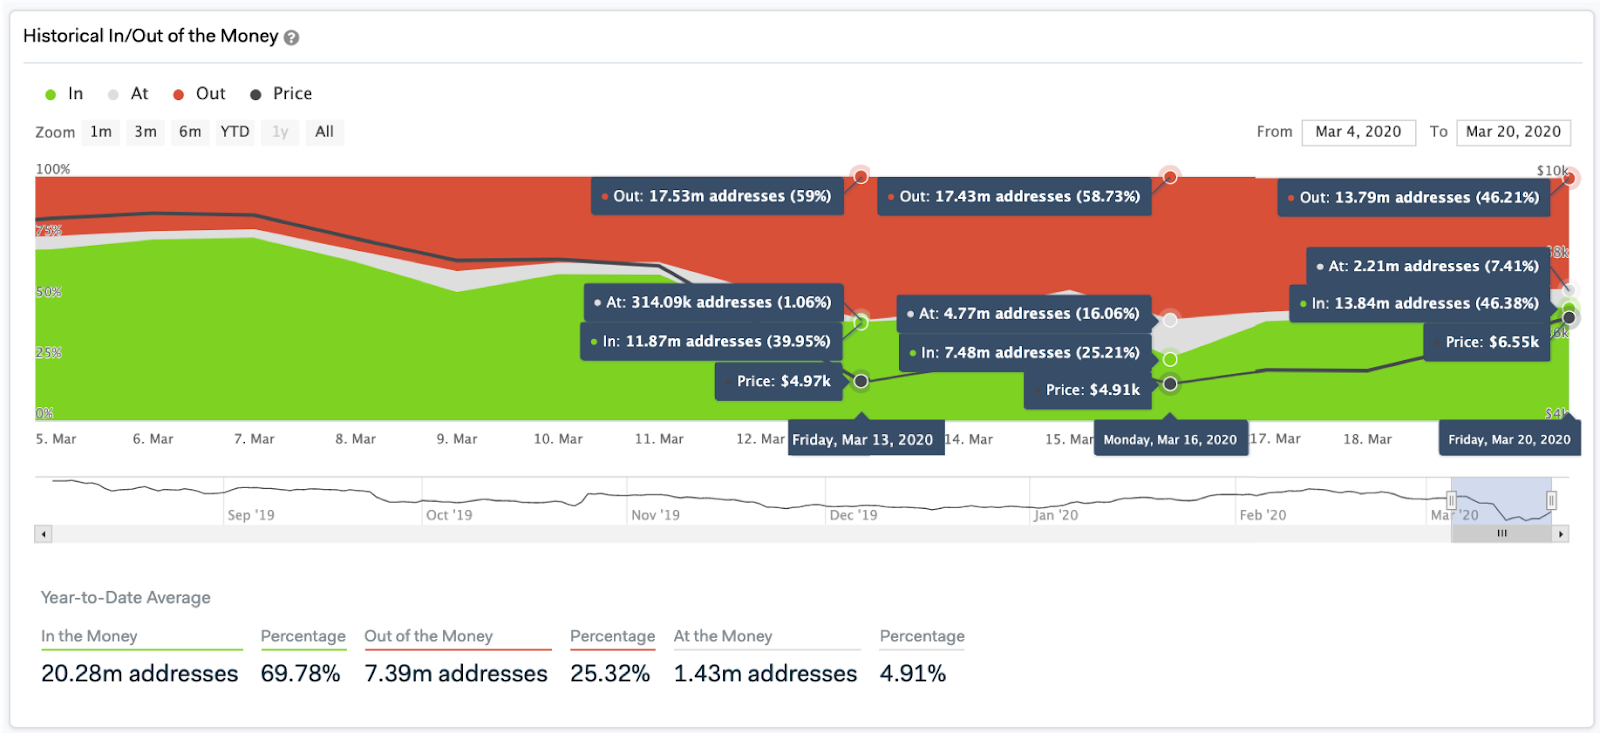
Since then the stats look a lot better with a more even distribution of “In the Money” (46.38%) and “Out of the Money” (46.21%) addresses.
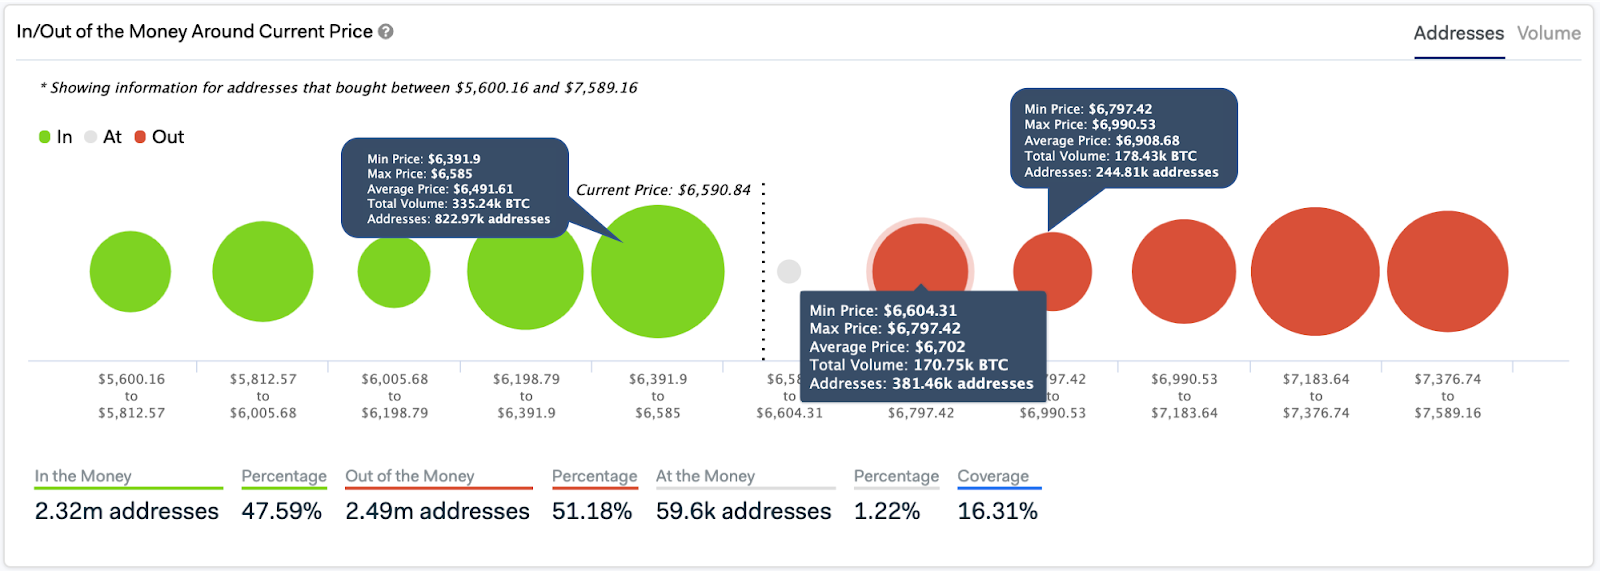
One last chart that is worth to mention is a zoom into the IOM analysis, showing 15% to both directions on Bitcoins’ current price, called “In/Out of the Money Around Current Price” or IOMAP. This visualization allows us to see that there are strong support levels all the way back towards USD $6,200 and less resistance on the road to $7,000.
It is no secret that Bitcoins’ volatility is up the roof lately, so it is still to be seen whether the price of BTC will stay around the $6.5k mark or will continue to push forward $7k. Let’s just hope it does.
