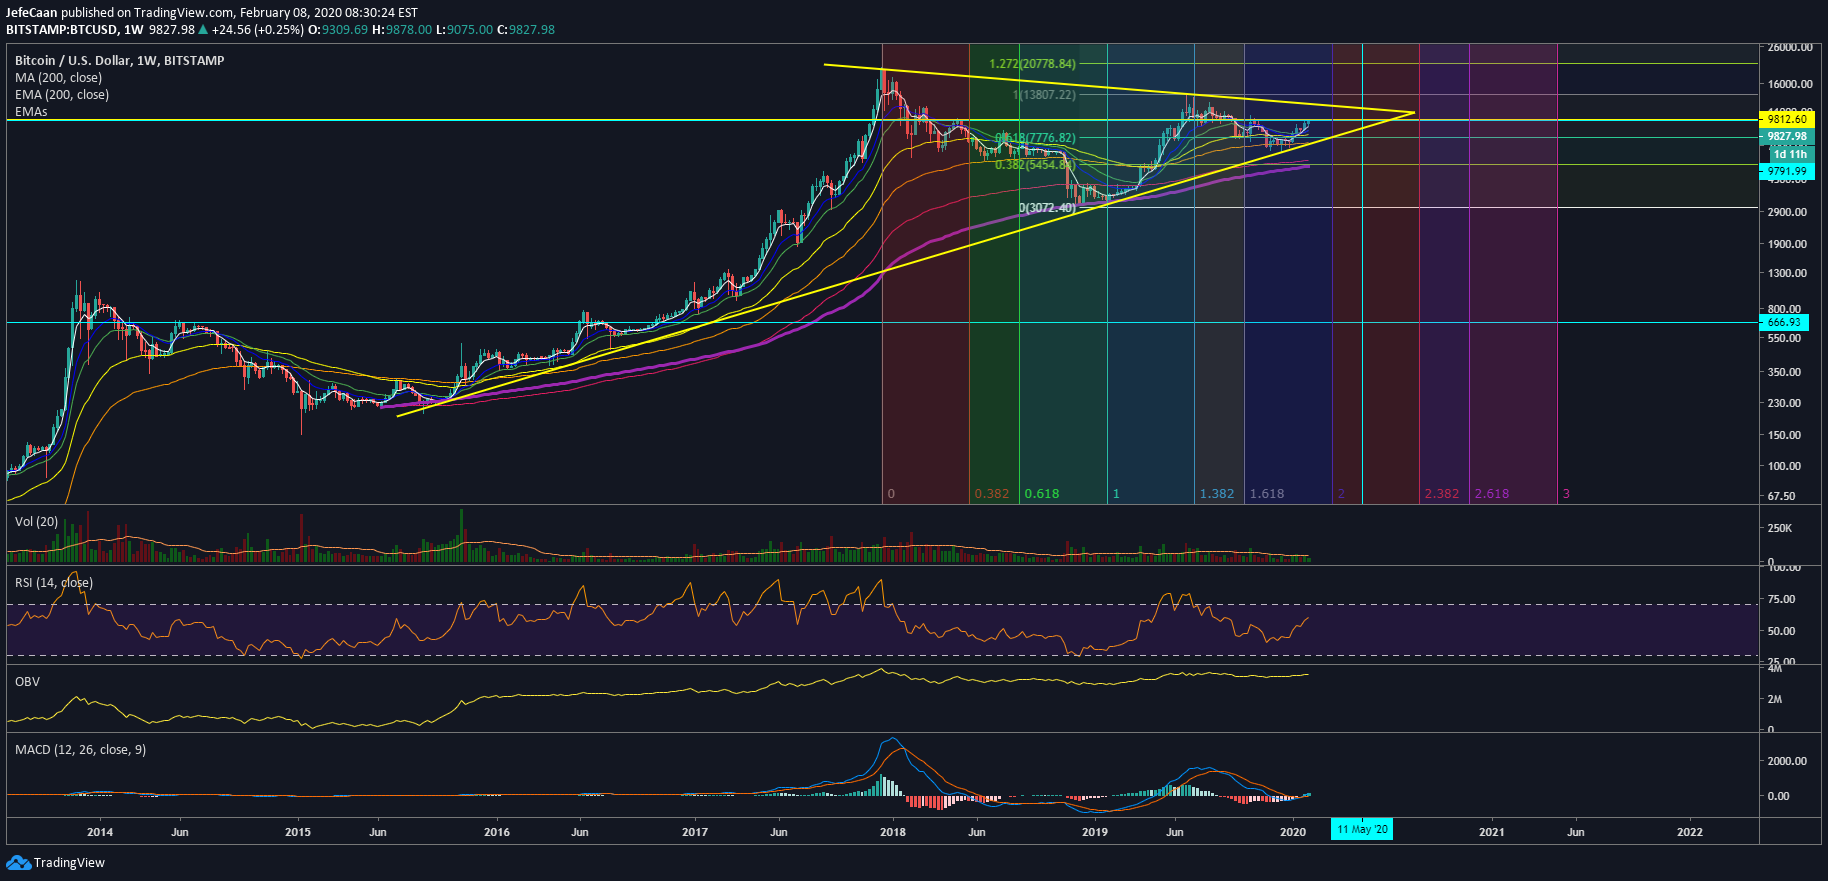
Bitcoin (BTC) is no doubt at one of the most important points in history. This is not just about the current cycle. We can see on the weekly chart that the next decline could mean something that we have not seen before and that is a decline below the 200-week moving average. It would also be a break below the current trend line support which means that BTC/USD might enter a prolonged bear market in the future. Simply put, it is not a matter of if Bitcoin will decline again but how and when it will do that. The game plan is to trap in as many bulls as possible while also shaking out retail bears out of their positions and discouraging them to short them market.

When the new year began, I was expecting some people to talk about how Bitcoin halving could be bullish for Bitcoin. However, even someone as bearish as myself underestimated the naivete and blind optimism of most investors in this market. The reason I call it blind optimism is because it will just take you 5 minutes to go and take a look at the two prior halving events to determine whether it has really been bullish for Bitcoin. I have also repeatedly said that halving is a part of the economic model of Bitcoin which means that it is bound to lead to an increase in the value of Bitcoin long term but it does not have to be immediate. The previous Bitcoin halving was on July 09, 2016. It is a fact that BTC/USD declined more than 32% three weeks after the halving.
Facts and figures like these can easily be confirmed on the charts but the problem is that most people don’t want to do that. They want to hear someone tell them, “Bitcoin is going to the moon”. That is a recipe for disaster because hoping and wishing does not work in any market. We talked about the halving of 2016. Let us talk about the halving of 2012 which was the first halving. It is also a fact that BTC/USD declined more than 40% in the weeks leading to that halving.
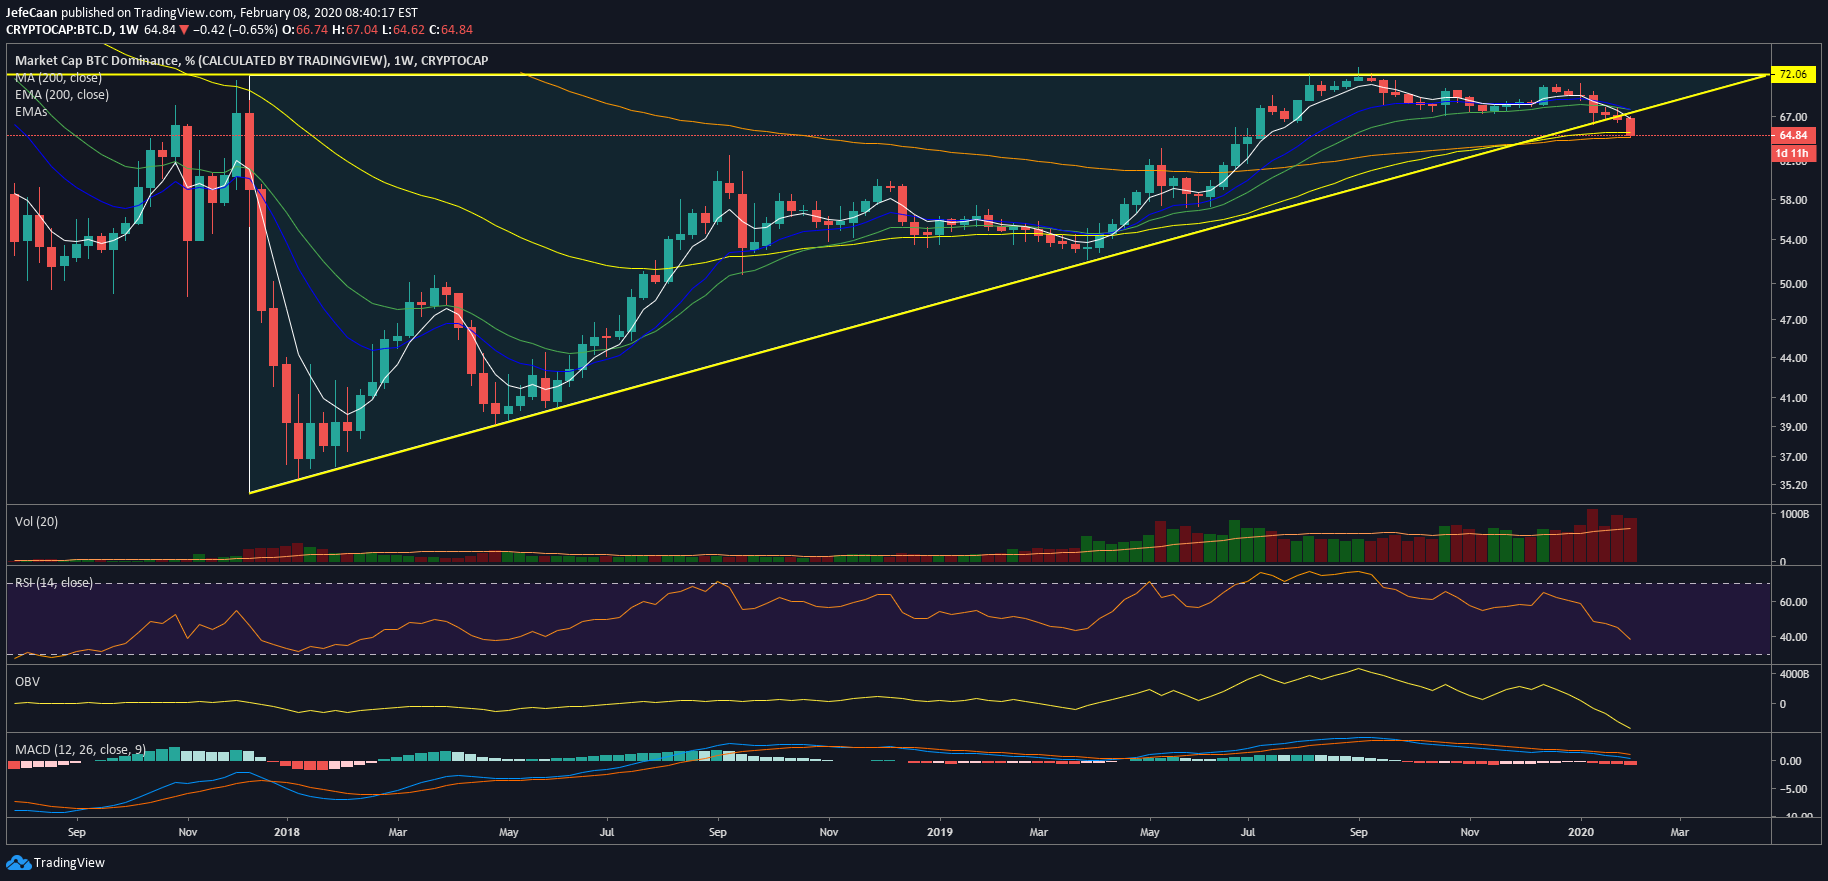
So, why is everyone so bullish about Bitcoin? It is the oldest reason there is which is hype or FOMO. The majority of retail traders will keep on making these same mistakes over and over. It has been happening since time immemorial and it is not going to change now. The weekly chart for Bitcoin dominance (BTC.D) is an important piece of the puzzle. We need to see it close the week above the 100-week exponential moving average for the market to head towards a correction. If Bitcoin dominance (BTC.D) closes below the 100 Week EMA, we would expect the altcoin rally to extend further before the beginning of the next downtrend.