Bitcoin (BTC/USD) ceded some recent gains early in today’s Asian session as the pair came off to the 9724.65 area after trading as high as the 9857.00 area during yesterday’s European session. The pair’s recent progress represents its strongest level since late October and was achieved after Stops were elected above the 9805, 9815, and 9845 levels. Additional Stops are likely in place around the 9961 and 9963 levels ahead of the psychologically-important 10000 figure. Above that area, upside price objectives include the 10060, 10104, 10167, 10313, and 10443 areas, all of which correspond to buying pressure that emerged around the 6430.00 and 6854.67 areas in late December and early January.
During pullbacks, traders will be interested to see if demand emerges around the 9497, 9370, and 9260 areas with additional technical support possible around the 9127 and 9047 levels. Chartists observe that the pair is trading above the 50-bar MA (4-hourly), and that the 50-bar MA (4-hourly) is indicating above the 100-bar MA (4-hourly) and 200-bar MA (4-hourly). Likewise, the pair is trading above the 50-bar MA (hourly), and the 50-bar MA (hourly) is indicating above the 100-bar MA (hourly) and 200-bar MA (hourly).
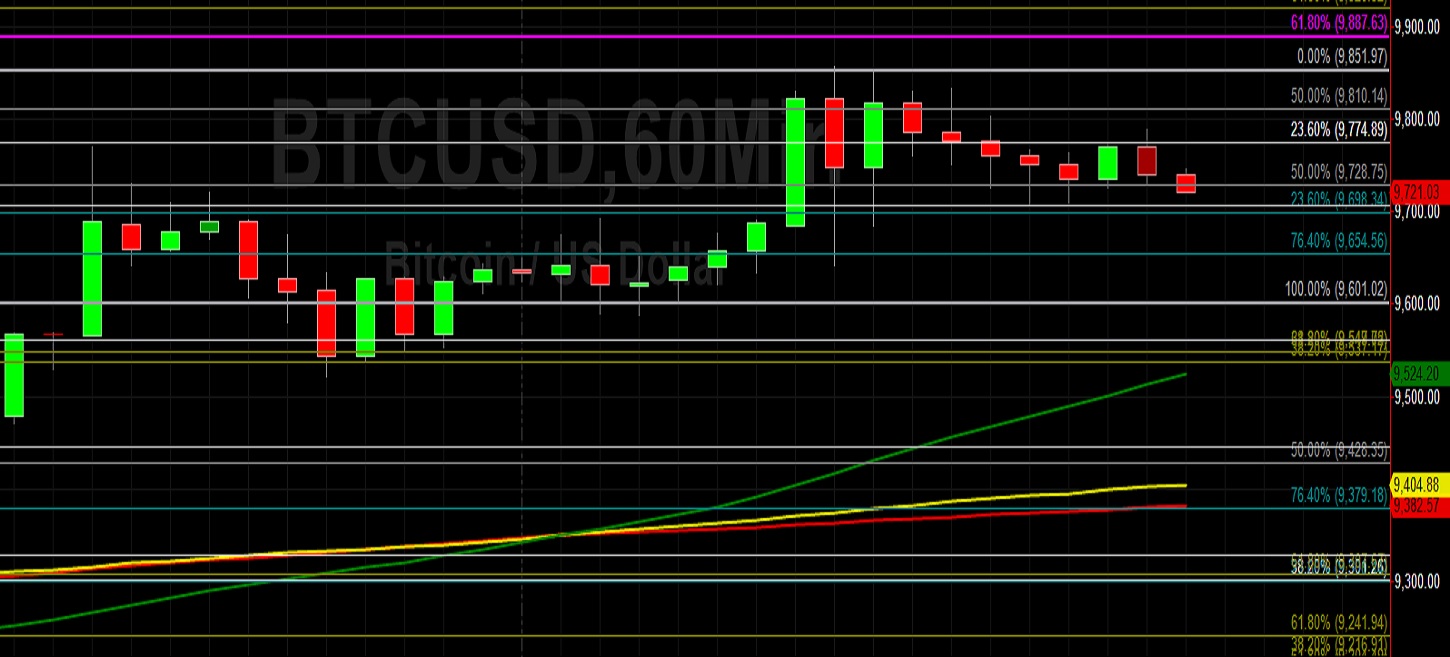
Price activity is nearest the 50-bar MA (4-hourly) at 9391.53 and the 50-bar MA (Hourly) at 9524.70.
Technical Support is expected around 9370.10/ 9128.51/ 8156.16 with Stops expected below.
Technical Resistance is expected around 9963.74/ 10167.80/ 10313.70 with Stops expected above.
On 4-Hourly chart, SlowK is Bearishly below SlowD while MACD is Bullishly above MACDAverage.
On 60-minute chart, SlowK is Bullishly above SlowD while MACD is Bearishly below MACDAverage.
Ethereum (ETH/USD) gained ground early in today’s Asian session as the pair traded as high as the 213.88 area after finding buying demand around the 205.41 area during yesterday’s European session. During yesterday’s North American session, the pair traded as high as the 216.49 area, a fresh multi-month high. This move was precipitated by strong upward buying pressure that saw Stops elected above the 206.68 level, an upside price objective related to a late-December low around the 122.18 area. Additional Stops were reached above the 215.09 area during the move higher.
Above current market levels, traders see the 225.78 level as being an upside price objective with Stops likely in place above this area. Traders are interested to see how the market reacts around the 196.19, 195.32, 188.92, and 187.51 levels during pullbacks. Additional upside price objectives include the 224.71 area. Chartists note that price activity is trading above the 50-bar MA (4-hourly) and 50-bar MA (hourly), and that the 50-bar MA (4-hourly) is indicating above the 100-bar MA (4-hourly) and 200-bar MA (4-hourly) while the 50-bar MA (hourly) is indicating above the 100-bar MA (hourly) and 200-bar MA (hourly).
Price activity is nearest the 50-bar MA (4-hourly) at 188.81 and the 50-bar MA (Hourly) at 201.93.
Technical Support is expected around 195.32/ 183.33/ 170.00 with Stops expected below.
Technical Resistance is expected around 216.49/ 225.78/ 243.62 with Stops expected above.
On 4-Hourly chart, SlowK is Bearishly below SlowD while MACD is Bullishly above MACDAverage.
On 60-minute chart, SlowK is Bullishly above SlowD while MACD is Bearishly below MACDAverage.