Published
4 years ago on
February 13, 2020
Bitcoin (BTC/USD) extended recent gains early in today’s Asian session as the pair traded as high as the 10392.99 area after finding technical support around the 10250.00 area during yesterday’s European session. Traders remain curious to see if the pair will be able to reclaim the 11000 figure, a level that has eluded the pair for several months. The key upside price objective that was closest to that recent high is the 10472.26 area, a level with a technical significance that became relevant after buying demand emerged around the 9078.05 area during the pair’s ascent. The next downside price objective related to these levels is the 10041.59 level.
One important level is the 9271.47 area that represents the 38.2% retracement of the move from 13868.44 to 6430.00. Some additional levels will also provide the pair with a real test if the market retraces lower. Among these levels, the 9532.39 area represents the 38.2% retracement of the move from 19891.99 to 3128.89 and the 9017.14 area represents the 38.2% retracement of the 13202.63 – 6430.00 range. Traders are also interested to see how price activity behaves around the 9731.18 area, representing the 23.6% retracement of the move from 8216.71 to 10199.00.
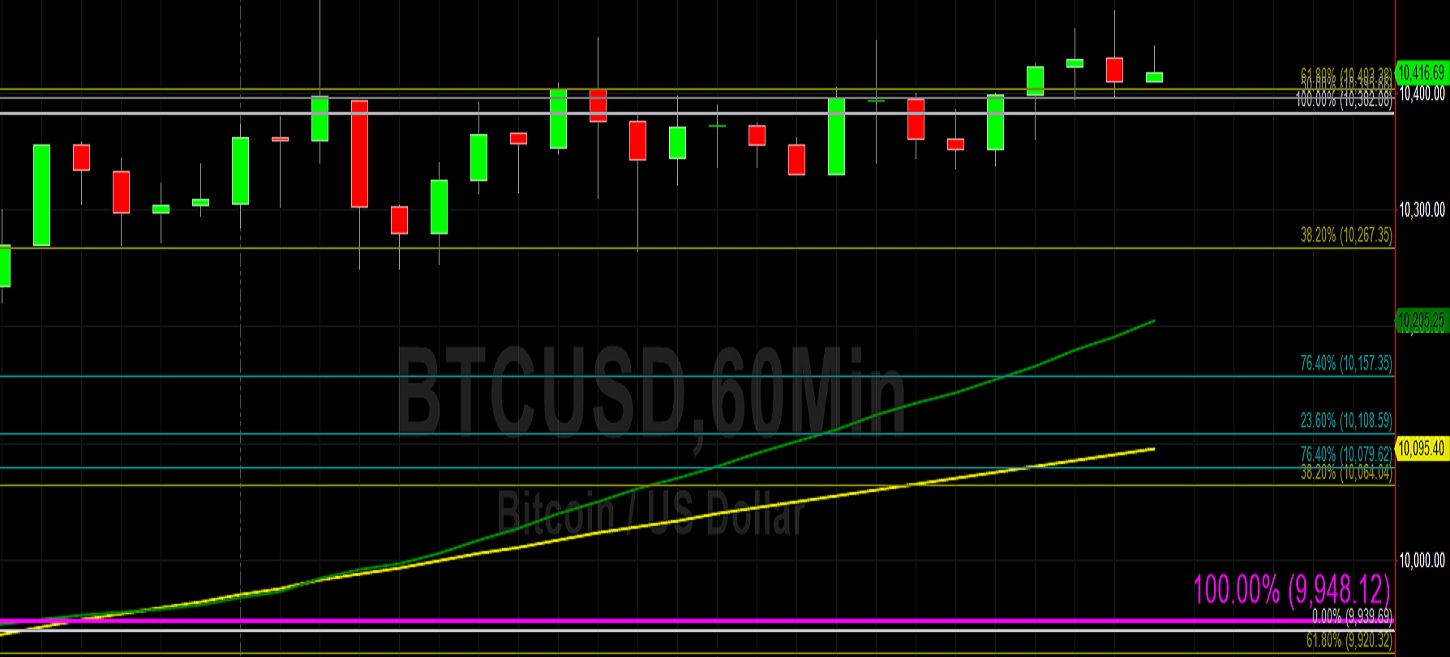
Price activity is nearest the 50-bar MA (4-hourly) at 9892.83 and the 50-bar MA (Hourly) at 10205.48.
Technical Support is expected around 9948.51/ 9757.64/ 9370.10 with Stops expected below.
Technical Resistance is expected around 10483.86/ 10534.04/ 10652.04 with Stops expected above.
On 4-Hourly chart, SlowK is Bullishly above SlowD while MACD is Bullishly above MACDAverage.
On 60-minute chart, SlowK is Bearishly below SlowD while MACD is Bullishly above MACDAverage.
Ethereum (ETH/USD) continued its upward trajectory early in today’s Asian session as the pair tested offers around the 276.15 level after finding technical support around the 252.22 area during yesterday’s European session. The markets are watching closely to see how long ETH/USD can remain above the psychologically-important 200.00 figure following its first trading activity above this level since September. The pair’s recent high was the 276.15 area, not too far above the 273.00 level that represents an upside price objective related to buying activity that emerged around the 184.29 area in early February.
The next upside price objective related to the buying pressure that emerged around the 116.25 level in late December is the 278.24 area, and the next downside price objective related to this particular buying pressure is the 240.04 area. One recent relative high around the 230.90 level was also near another important level, namely the 229.46 area that represents the 61.8% retracement of the move from 146.00 to 364.49. During the market’s recent pullback, the market was supported around the 216.31 area, just below the 216.53 area that represents the 23.6% retracement of the move from 170.00 to 230.90. Below this level, the 207.64 area is the next downside retracement level.
Investment Disclaimer