Published
4 years ago on
February 12, 2020
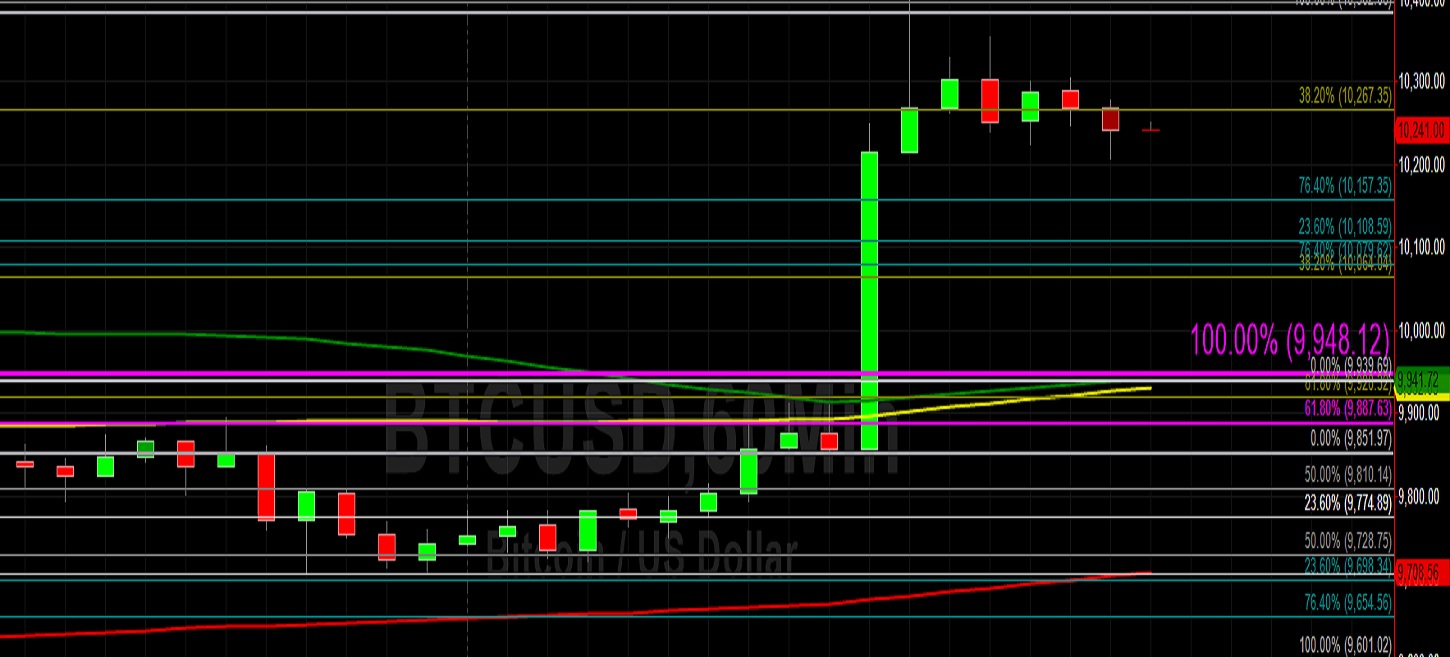
Bitcoin (BTC/USD) appreciated early in today’s Asian session as the pair traded as high as the 10304.49 level after having traded as high as the 10400.00 level during yesterday’s North American session, a fresh multi-month high. The move yesterday was a reversal of the recent move back below the psychologically-important 10000 figure and tested technical support around the 9736.00 area, just below the 9740.35 area that represents an upside price objective related to buying pressure that emerged weeks ago around the 6854.67 area. Stops were elected above some key technical levels during the move higher, including the 10215.41, 10239.21, 10313.70, 10366.79, and 10397.09 areas. Chartists are closely monitoring the convergence of the 50-bar MA (hourly) and 100-bar MA (hourly).
The 10397.09 area was just below the pair’s 10400.00 high, and its technical significance relates to buying pressure that emerged around the 8880.87 area during its recent move higher. The next upside retracement level related to the buying activity around the 8880.87 area is the 11622.52 area. If BTC/USD continues its upward trajectory, upside price objectives include the 10421.37, 10447.47, 10472.26, 10513.53, and 10615.81 levels. Below current market activity, traders anticipate some demand around the 10060.54, 9983.33, 9740.35, 9629.35, and 9462.00 areas.
Price activity is nearest the 50-bar MA (4-hourly) at 9731.01 and the 50-bar MA (Hourly) at 9937.80.
Technical Support is expected around 9948.51/ 9757.64/ 9370.10 with Stops expected below.
Technical Resistance is expected around 10472.26/ 10534.04/ 10652.04 with Stops expected above.
On 4-Hourly chart, SlowK is Bullishly above SlowD while MACD is Bullishly above MACDAverage.
On 60-minute chart, SlowK is Bearishly below SlowD while MACD is Bullishly above MACDAverage.
Ethereum (ETH/USD) extended recent gains early in today’s Asian session as the pair traded as high as the 239.92 level during yesterday’s North American session, a new multi-month high. Several Stops were elected during the pair’s move higher including around the 232.42, 234.12, 236.90, 239.11, and 239.55 levels. Notably, the pair stopped just short of testing the 240.01 area, an upside price objective with a technical significance that became relevant when buying pressure emerged around the 154.48 area. The next upside price objective related to these levels is the 278.24 area.
The reversal higher took place after traders tested bids around the 217.83 level during yesterday’s Asian session. Upside price objectives include the 240.72, 241.99, 247.45, 250.04, 255.09, 257.11, 259.14, and 260.41 levels. Below current market activity, traders cite potential technical support around the 211.35, 210.39, 209.02, 207.70, and 204.72 areas. These are levels that represent upside price objectives based on buying activity that has emerged around the 116.25, 142.10, and 154.48 area during recent weeks. Chartists are closely monitoring the convergence of the 50-bar MA (hourly) and the 100-bar MA (hourly).
Price activity is nearest the 50-bar MA (4-hourly) at 213.86 and the 100-bar MA (Hourly) at 224.64.
Technical Support is expected around 230.27/ 226.38/ 222.73 with Stops expected below.
Technical Resistance is expected around 243.62/ 247.45/ 250.04 with Stops expected above.
On 4-Hourly chart, SlowK is Bullishly above SlowD while MACD is Bullishly above MACDAverage.
On 60-minute chart, SlowK is Bearishly below SlowD while MACD is Bullishly above MACDAverage.
Investment Disclaimer