Published
4 years ago on
February 11, 2020
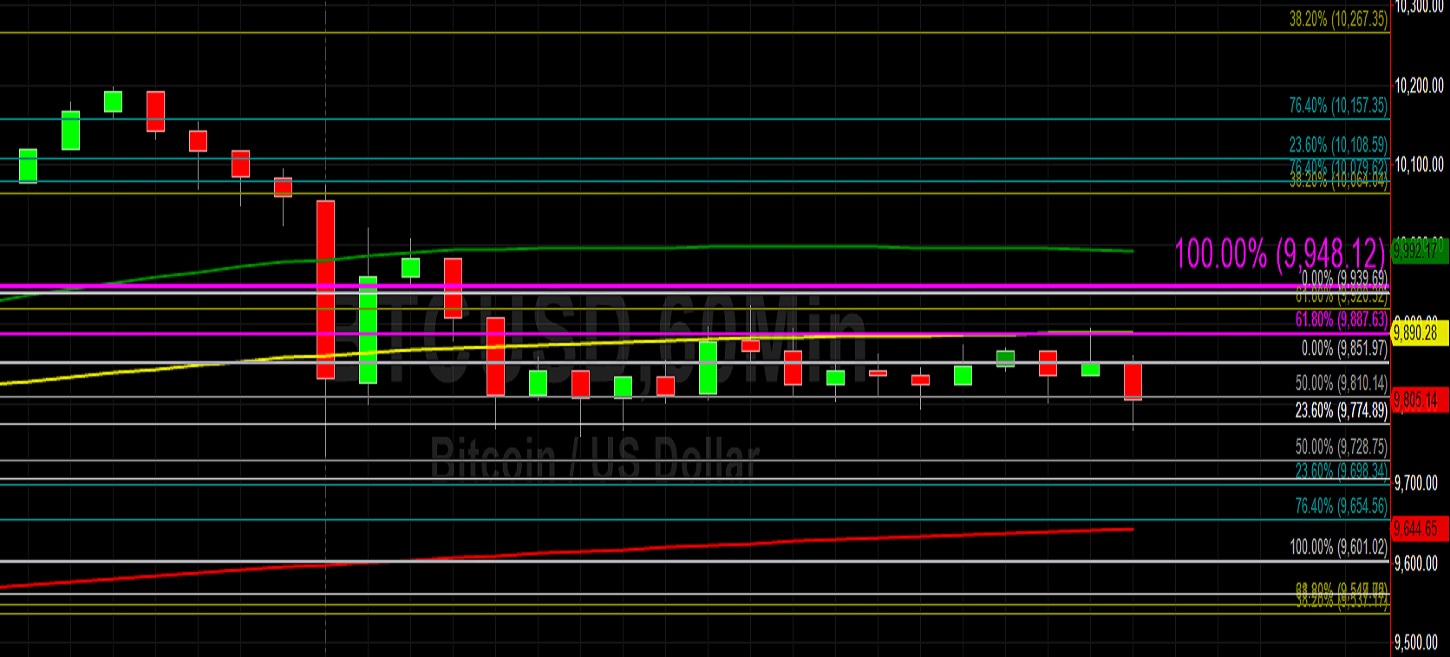
Bitcoin (BTC/USD) weakened early in today’s Asian session as the pair declined to the 9790.39 area after peaking around the 10199.00 area during yesterday’s Asian session. Prior to moving back below the psychologically-important 10000 figure, the pair has notched a remarkable 38.6% gain since the beginning of the year, partially reclaiming some of the 53.6% decline in value from its peak in June to its lowest point of 6430.00 in December. Traders continue to monitor important technical levels, including the 9570.41 area that represents the 76.4% retracement of the depreciation from 10540.49 to 6430.00. Likewise, another important level is the 9816.32 area, representing the 50% retracement of the broader depreciation from 13202.63 to 6430.00.
The pair, however, moved below this area yesterday. The next upside retracement level in this range is the 10615.49 area. Stops were recently triggered above the 9845.15 area, an important upside price objective with a technical significance that became solidified after buying pressure emerged around the 8041.95 area following the late-December low around the 6430.00 area. The next upside price objective in this range is the 9961.01 area. Other important upside price objectives include the 9948, 9955, 9963, 9983, 10017, 10041, and 10060 levels. Additional upside price targets include the 10104, 10134, and 10167 areas, above which some Stops are likely in place.
Price activity is nearest the 50-bar MA (4-hourly) at 9650.86 and the 100-bar MA (Hourly) at 9890.05.
Technical Support is expected around 9601.02/ 9370.10/ 9241.94 with Stops expected below.
Technical Resistance is expected around 10215.41/ 10239.21/ 10313.70 with Stops expected above.
On 4-Hourly chart, SlowK is Bearishly below SlowD while MACD is Bearishly below MACDAverage.
On 60-minute chart, SlowK is Bearishly below SlowD while MACD is Bullishly above MACDAverage.
Ethereum (ETH/USD) depreciated early in today’s Asian session as the pair slumped to the 219.29 level after trading as high as the 229.60 area during yesterday’s North American session. Prior to the pullback, the pair had registered an impressive 72.8% appreciation since the beginning of the year, partially offsetting some of the 68.1% depreciation that ETH/USD registered between its late-June peak of 364.49 and its December low of 116.25. Traders rightfully anticipated some selling pressure between the 229.46 and 234.60 levels. Chartists note that the 243.62 area is another upside price objective, one that represents the 50% retracement of the move from 122.75 to 364.49. Additional selling pressure is likely in place between the 246 and 249 areas.
Stops were recently elected above the 222.73 level, an upside price objective that became technically relevant after bids emerged around the 184.29 level. Likewise, additional Stops were triggered above the 223.53 area, another upside price objective that became significant after bids recently emerged around the 170.00 level. The 230.55 area is another nearby upside price objective and Stops are likely in place above it. Above that area, additional upside price objectives include the 232.54, 236.90, 239.11, and 240.22 areas. Additionally, there are range of upside price objectives between the 247.45 and 252.59 levels.
Price activity is nearest the 50-bar MA (4-hourly) at 209.25 and the 100-bar MA (Hourly) at 222.89.
Technical Support is expected around 209.75/ 201.38/ 195.32 with Stops expected below.
Technical Resistance is expected around 229.46/ 236.90/ 243.62 with Stops expected above.
On 4-Hourly chart, SlowK is Bullishly above SlowD while MACD is Bearishly below MACDAverage.
On 60-minute chart, SlowK is Bearishly below SlowD while MACD is Bullishly above MACDAverage.
Investment Disclaimer