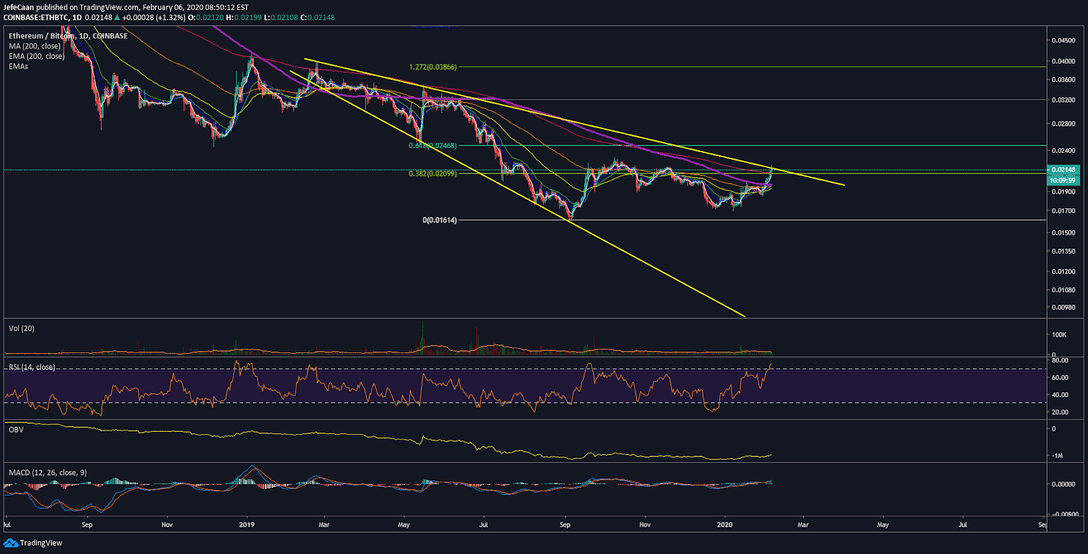
Ethereum (ETH) has finally run into the 200-day exponential moving average against Bitcoin (BTC) and successfully tested it. In fact, the daily chart for ETH/BTC shows the pair trading above it at the moment. However, we can see what Ethereum (ETH) stands to lose against Bitcoin (BTC) in the days and weeks ahead should it begin another downtrend which we expect it to. If Ethereum (ETH) breaks this downtrend against Bitcoin (BTC) and does not decline below the 200-day moving average, then this would have been it for the bear market and we would be looking at the beginning of a new bullish cycle.

So far, that does not seem to be the case. We have seen ETH/BTC break above the 200-day moving average before with no follow through. The same thing seems to be happening again. There is one thing similar in all of such moves and that is a constant pumping of the price with little to no retracements. This is not what organic growth looks like and no matter how hard the whales and market makers try; it is always going to look like this because it is not real. No matter how good of a trader you think you are, it is important to always wait for confirmation rather than being put out of your position for not waiting to see that the price is doing what you expect it to.
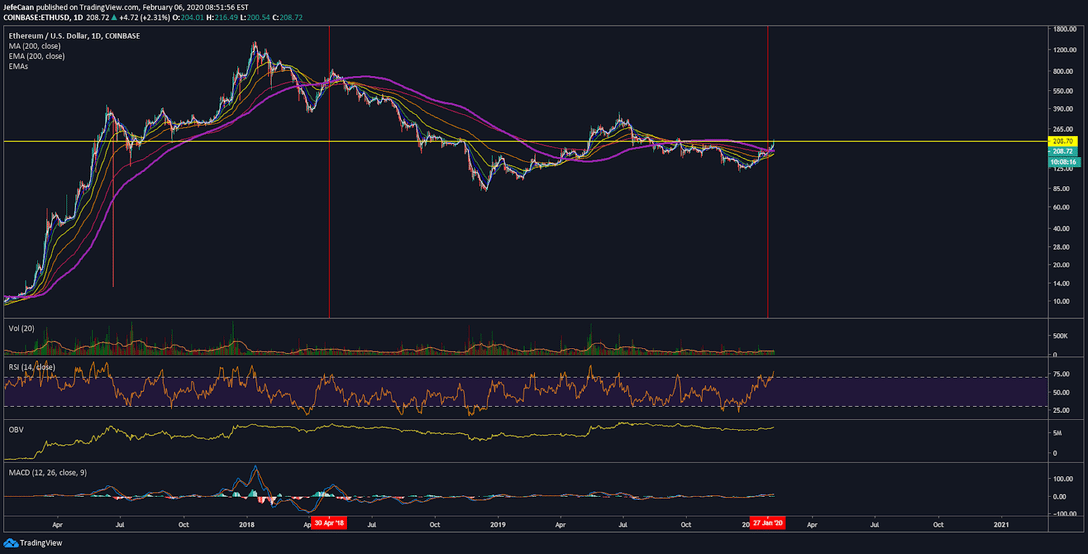
The 200-day moving average in both the case of ETH/BTC and ETH/USD is one simple way to determine what is going on and what to expect next. If we see a decline down to this level with follow through and Ethereum (ETH) ends up forming higher highs and higher lows, that would be a point where you would want to look for bullish entries provided that other conditions align as well based on your strategy. However, if the price declines below the 200-day moving average to form a lower high and lower low, that is a point where you think about entering bearish positions expecting the price to fall further.
We can see on the daily chart for ETH/USD that so far, we have no reason to be bullish on the market. In fact, we would be very close to having a reason to be strongly bearish if and when the price slides below the 200-day moving average again. None of us should have expected any of this to be simple or straightforward at this point. It simply cannot be because the stakes are too high. This is the sweet spot for the market makers to trap in as many retail bulls as possible and to shake out as many retail bears as possible that are trying to aggressively short this market.