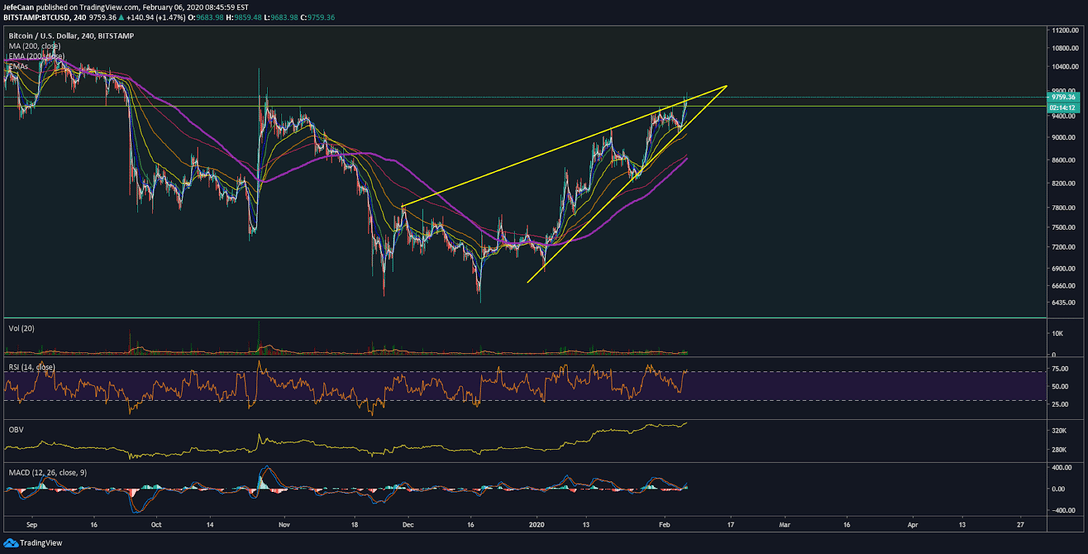
Bitcoin (BTC) is all set to break out of the key rising wedge that it started trading in when it formed a temporary bottom last year around $6.4k and started to rally. We can see on the 4H chart for BTC/USD that soon as the 200-day moving average was broken to the upside, the price ended up rising aggressively. We are now looking at a break out of the rising wedge. Most of the time in classical technical analysis, we see such rising wedges break to the downside. Sometimes there is a move to the upside and the rising wedge enters a larger rising wedge. This has also happened numerous times before but despite any such moves, we have seen that the price eventually does end up declining most of the time.

It is not surprising to see everyone talking about a rally to the moon in Bitcoin just before the next halving. This is a narrative that has been carefully crafted and put in the minds of retail traders no matter how false it may be. It is my opinion that halving has not had an immediate impact based on the limited data that we have available for just two halving events. It has more to do with market cycles than halving. Certainly, halving is the economic model behind Bitcoin’s successive bullish cycles but it does not mean that we should start buying before a halving event expecting the price to shoot to the moon immediately. Markets can stay irrational longer than investors can stay solvent and that is what I think will happen here.
I have observed recently that the halving FOMO is so strong that most retail bulls when faced with compelling evidence of an imminent decline start talking about the “limited supply of Bitcoin” and how there is always going to be “21 million” of them ever in existence. These are signs of a weak trading strategy. In fact, we must never substitute technicals for fundamentals or vice versa.
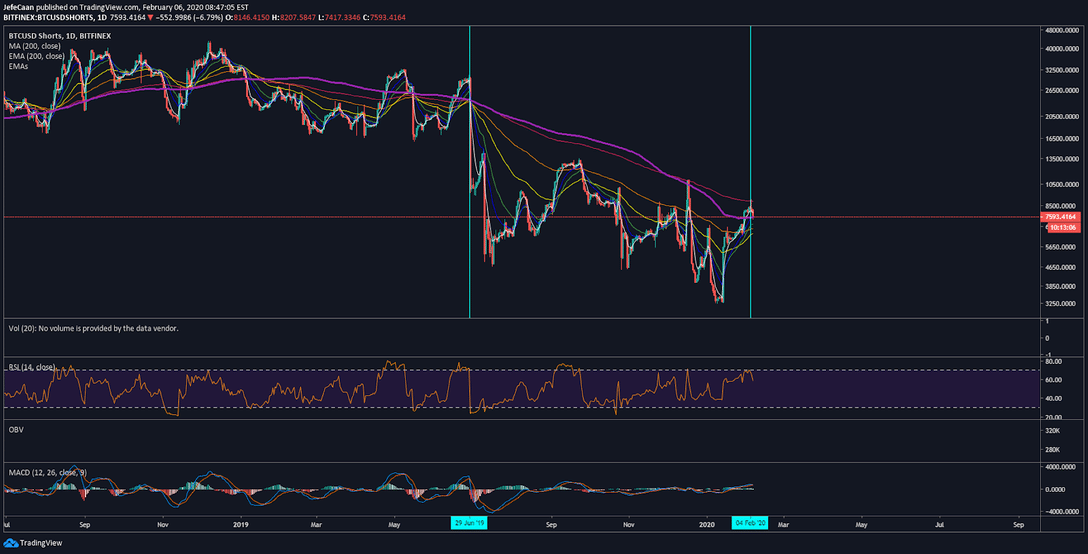
In my opinion, the technicals always come first and fundamentals align to support those technicals. This has been my experience in this market as well as in traditional markets. Whenever the price has to fall, you would see some negative news that will serve as an alibi for that fall and vice versa for a rise in price. We can now observe on the daily chart for BTCUSDShorts that the last time the number of shorts declined below the 200-day moving average was just before July, 2019. The price of Bitcoin (BTC) had just peaked out and entered a major downtrend when that happened. We are now in a similar position and would like see a similar outcome.