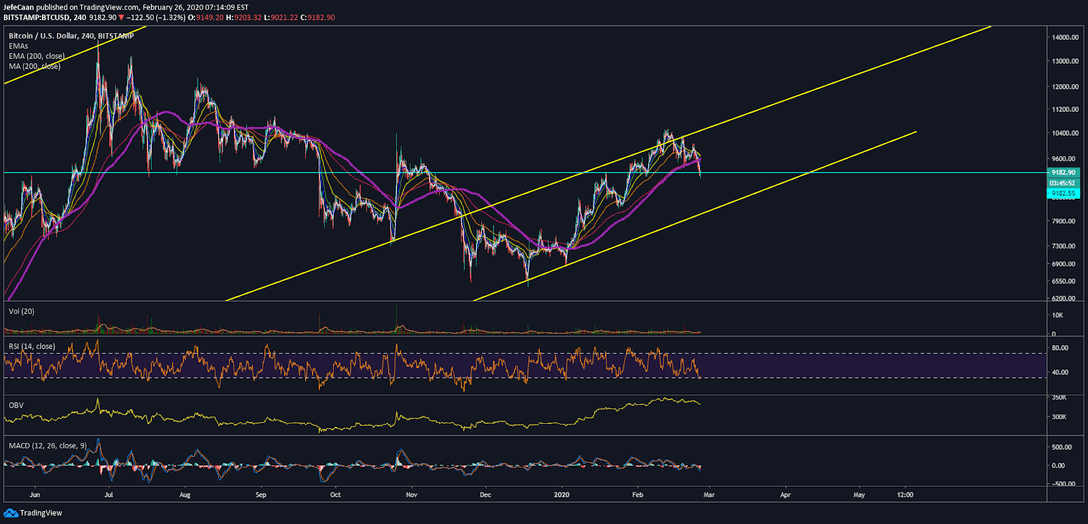
Bitcoin (BTC) is days away from the next big move. The price has declined down to an important support. So far it is trading slightly below it but the bulls can still rescue the price. The 4H chart for BTC/USD shows a potential ascending channel that the price could now be trading in. It remains to be seen if this is indeed going to be the path that the market takes in the near future but for now it is clear that the bulls are losing control. So, a decline down to the bottom of the ascending channel does seem quite probable.

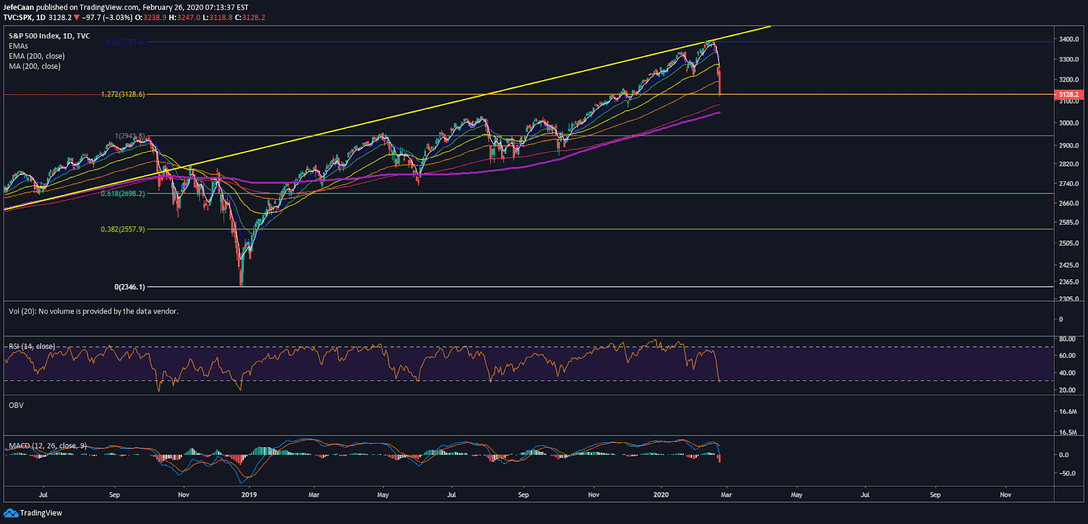
It is important to note that the recent break below the 200-moving average on the 4H time frame is a major bearish development and as long as the price remains below it, we remain bearish. The market lacks the momentum to rally higher from here and the big players are trying too hard to keep retail traders optimistic. They are running out of options as the stock market continues to decline. Yesterday’s close on the S&P 500 (SPX) was quite bearish and it may not be over yet. We have yet to see the index decline further now that it has closed below the 50-day exponential moving average. The most probable scenario is a decline down to the 200-day moving average in the weeks ahead. The Coronavirus situation has certainly got markets concerned but that is not the only factor.
There are some analysts that are saying that Wall Street is using the Coronavirus as an alibi to take profits and that is why the market is going down. That is true to an extent but there is no denying that Wall Street is really concerned and it is not just about the Coronavirus. Bernie Sander’s recent win in Nevada has the establishment very concerned not only because he won but the manner in which he won gaining the support of the Latino and African American community.
The daily chart for S&P 500 (SPX) shows that if we disregard all the news and other events, for technical reasons alone it made a lot of sense for the index to decline when it did. It had just run into a key resistance at the 1.618 fib level and now it has declined down to the 1.272 fib level. If it fails to hold this level, we would be looking at a decline down to the 200-day moving average where the index would be expected to find some sort of support even if it is temporary before the next major move.