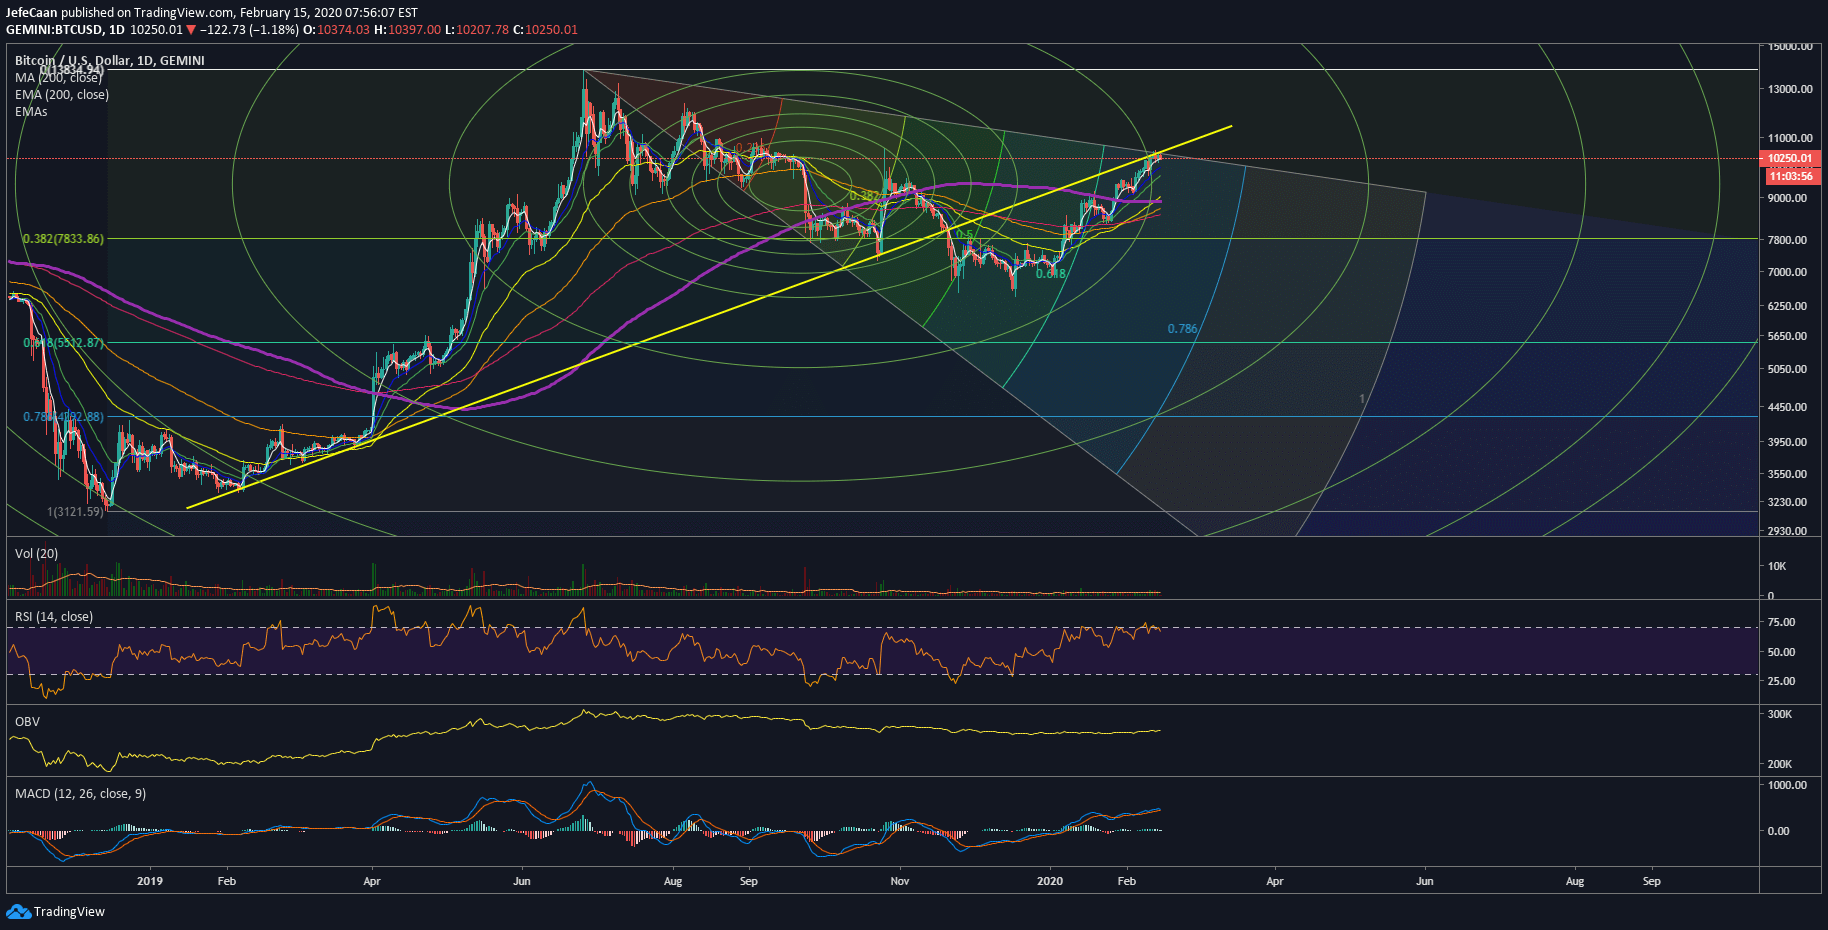
Bitcoin (BTC) cannot stall the next decisive move for long. We can see on the daily chart for BTC/USD that the price has already run into a key trend line resistance. This used to be an important trend line support but when the price broke below it in December, 2019 to continue its decline towards $3.2k, it became a strong resistance. This is the first time after all that time that BTC/USD has tested this trend line as resistance. While the majority of the market is still rooting for a bullish continuation, it may be time to look the other way as a contrarian investor.

One thing that is important to realize is that being a contrarian does not mean getting in front of a bullet train. Bitcoin (BTC) has been pumping hard in the past few weeks but altcoins have been pumping even harder and to try to short coins like Ripple (XRP) or Ethereum (ETH) without a risk management strategy could be disastrous in a situation like this. Most people enter positions too early because they don’t want to miss that small 2-3 % move which they end up paying a lot more for when the trade goes against them. It is fine not to catch the top or the bottom. The Rothschild 80/20 rule states that you can take 20% of the top and the bottom and I’ll take everything in between. This is successful trading in a nutshell.
Most traders lose money because they are trying to predict reversals or continuations past certain S/R levels. There is enough money to be made trading what’s in between so there is no reason to be greedy. However, it is important to be foresighted. You have to know rough odds of the different outcomes otherwise you would not be well positioned to take advantage of them. In the case of BTC/USD, those odds are not only of movements in the cryptocurrency market but also in related markets.
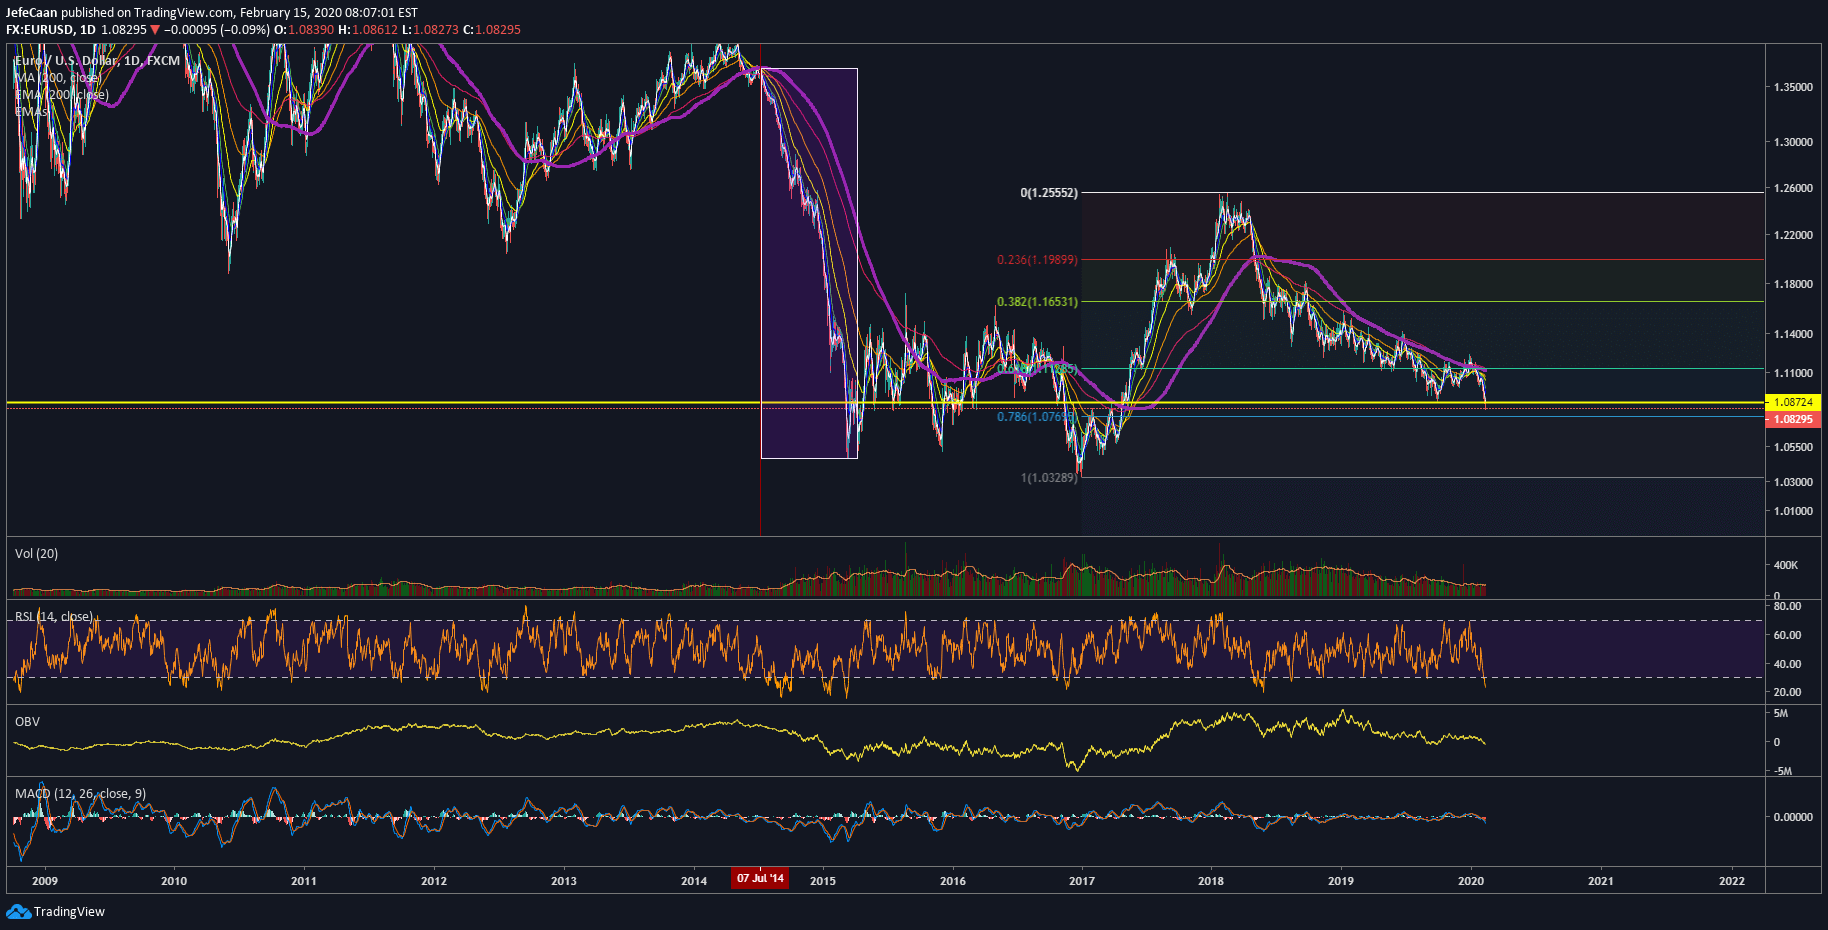
The EUR/USD forex pair has historically had a strong impact on movements in Bitcoin (BTC). We can see on the daily chart that the pair has declined below a key support at the 1.08724 level and is now eyeing further downside towards the 78.6% fib retracement level. My opinion is that it may continue to decline lower than the 78.6% fib retracement level. If we look at the current fractal and compare it with the one from 2014 (highlighted on the chart), we can see that EUR/USD risked a similar downtrend in July, 2014 when it declined below the 200-day moving average. The result was a brutal downtrend not only in EUR/USD but in BTC/USD as well. The price of Bitcoin (BTC) crashed from $654 to $161, a decline of more than 76% in a period of six months.