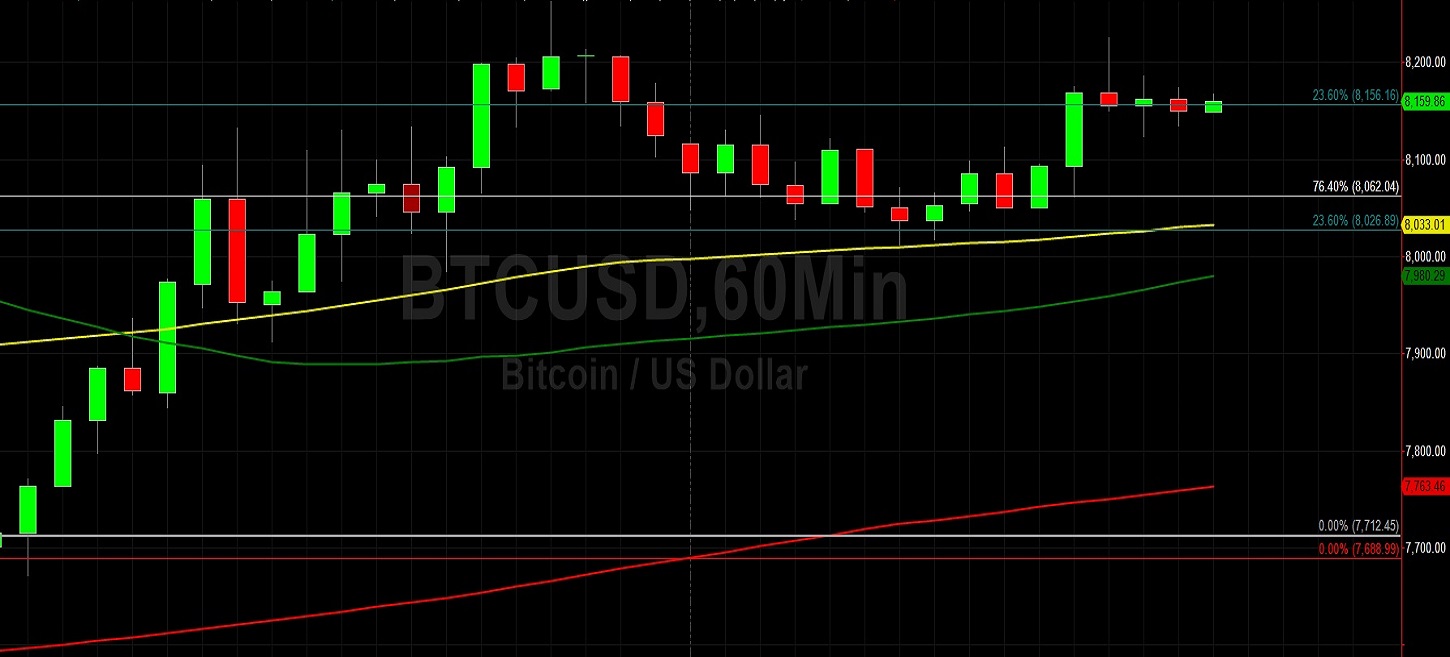
Bitcoin (BTC/USD) appreciated early in today’s Asian session as the pair climbed to the 8225.09 area after trading as low as the 8011.56 area during yesterday’s European session. Above this level, traders continue to watch the 8280.97 level, representing the 76.4% retracement of the 8469.39 – 7671.00 range. The pair has gained decent ground after trading as low as the 7671 area during Friday’s European session, just above the 7661.79 area that is an upside price objective. Offers emerged during yesterday’s North American session just above the 8219.84 area, a level that represents the 38.2% retracement of the 10950.57 – 6531.91 range.
Chartists have noted that the pair continues to trade above the 50-bar MA (4-hourly), and that the 50-bar MA (4-hourly) continues to indicate above the 100-bar MA (4-hourly) and 200-bar MA (4-hourly). Also, the pair continued to trade above the 100-bar MA (hourly), and the 100-bar MA (hourly) continues to indicate above the 50-bar MA (hourly). Below current price activity, traders anticipate Bids around the 7597, 7473, 7313, and 7117 areas. Above current price activity, traders anticipate Offers around the 8340, 8585, and 8799 areas.
Price activity is nearest the 50-bar MA (4-hourly) at 7,773.58 and the 100-bar MA (Hourly) at 8,030.63.
Technical Support is expected around 7662.03/ 7568.45/ 6526.00 with Stops expected below.
Technical Resistance is expected around 8587.90/ 8799.53/ 9006.95 with Stops expected above.
On 4-Hourly chart, SlowK is Bullishly above SlowD while MACD is Bullishly above MACDAverage.
On 60-minute chart, SlowK is Bullishly above SlowD while MACD is Bullishly above MACDAverage.
Ethereum (ETH/USD) extended recent gains early in today’s Asian session as the pair traded as high as the 148.00 figure after Bids emerged around the 142.11 area during yesterday’s European session. Notably, the pair encountered strong technical resistance around the 148.00 figure on 7 January as well, and this is because that level is just below an upside price objective around the 148.09 area. More importantly, the 148.05 area is technical resistance because it represents the 38.2% retracement of the 199.50 – 116.25 range. The pair has been bid from the 135.26 area over the past couple of days, having found buying pressure around the 200-bar MA (4-hourly) a couple of days ago.
Stops were elected above the 144.96 area during the move higher, representing the 76.4% retracement of the 148.00 – 135.12 range. The next downside retracement levels in that range include the 143.08, 141.56, 140.04, and 138.16 levels. Likewise, traders are waiting to see if the pair can remain above the 141.76 and 135.90 areas, representing the 23.6% retracements of the 224.34 – 116.25 range and 199.50 – 116.25 range. Below current price activity, traders will pay close attention to levels including the 134.14, 132.46, 130.00, and 128.15 areas. Above current market activity, traders will pay close attention to levels including the 148.05, 148.74, 151.17, and 151.61 areas.
Price activity is nearest the 50-bar MA (4-hourly) at 139.34 and the 100-bar MA (Hourly) at 141.07.
Technical Support is expected around 135.12/ 132.90/ 130.83 with Stops expected below.
Technical Resistance is expected around 148.74/ 153.00/ 157.73 with Stops expected above.
On 4-Hourly chart, SlowK is Bullishly above SlowD while MACD is Bullishly above MACDAverage.
On 60-minute chart, SlowK is Bearishly below SlowD while MACD is Bullishly above MACDAverage.
Investment Disclaimer


