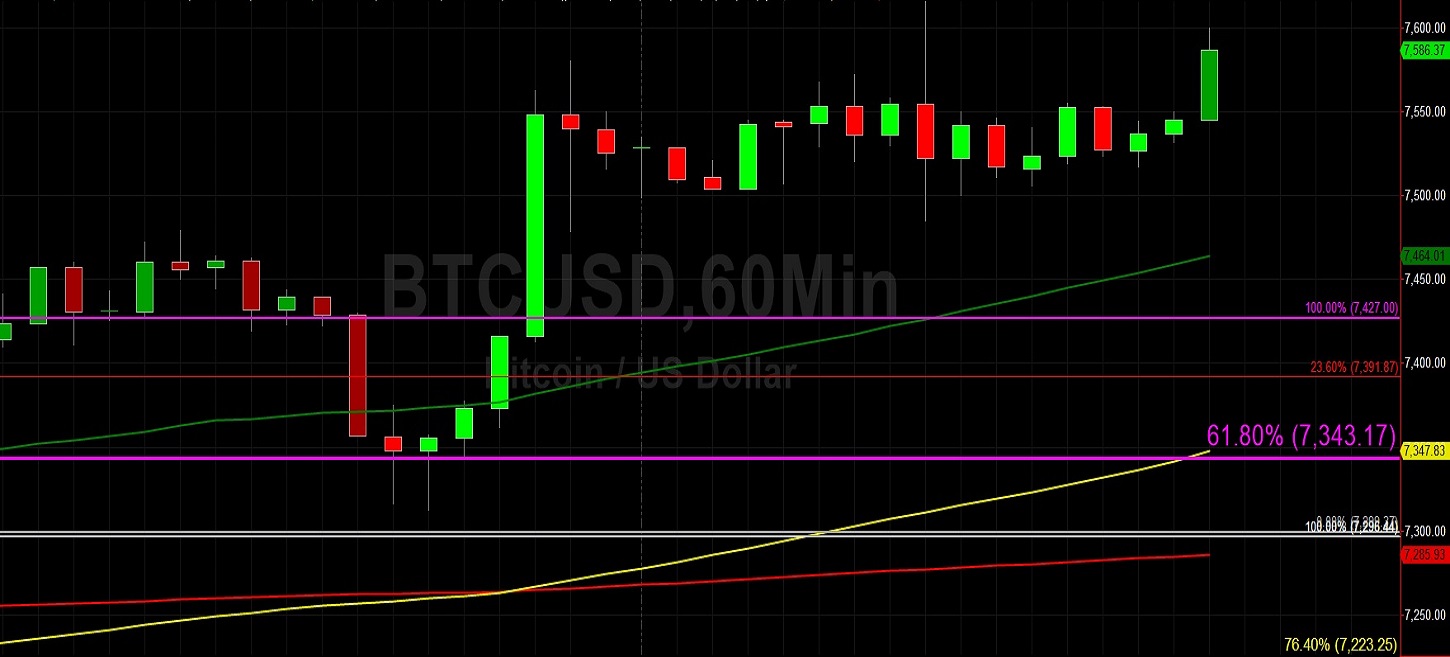
Bitcoin (BTC/USD) extended its recent gains early in today’s Asian session as the pair climbed to 7577.00 area after trading as high as the 7615.68 area during yesterday’s North American session. Earlier, buying demand emerged around the 7312.22 level during yesterday’s Asian session. During the past three weeks, the pair has orbited the 7343.17 level, representing the 61.8% retracement of the 9948.12 – 3128.89 range. The pair’s recent inability to make a sustained break above the 7473.42 area, representing the 23.6% retracement of the 10540.49 – 6526.00 range, means BTC/USD Bears remain in charge. The pair’s long-term bias remains negative, especially given the intense amount of selling pressure the markets have seen since the pair peaked around the 10540.49 area in late October.
The markets will need to make a sustained break above the 7870 area if BTC/USD Bulls are able to muscle the markets higher. Traders anticipate some Stops are in place above the 7688 and 7775 levels, and if they are elected they may propel BTC/USD to challenge the psychologically-important 8000 figure. Below current market activity, traders anticipate some Bids around the 6727, 6538, and 6440 areas. Stops are likely in place below the 6854 area. Above current market activity, traders anticipate some selling pressure around the 8062, 8213, 8338, and 8535 levels. Stops are likely in place above the 8735 area.
Price activity is nearest the 50-bar MA (4-hourly) at 7,291.88 and the 50-bar MA (Hourly) at 7,463.61.
Technical Support is expected around 6526.00/ 6323.42/ 5941.26 with Stops expected below.
Technical Resistance is expected around 7870.10/ 7927.23/ 8338.78 with Stops expected above.
On 4-Hourly chart, SlowK is Bearishly below SlowD while MACD is Bullishly above MACDAverage.
On 60-minute chart, SlowK is Bullishly above SlowD while MACD is Bearishly below MACDAverage.
Ethereum (ETH/USD) gained ground early in today’s Asian session as the pair appreciated to the 142.99 level, up from the 134.15 area during yesterday’s North American session. Even though these prints are the pair’s strongest since mid-December, the pair’s long-term bias remains relatively negative. In late October, the pair traded as high as the 199.50 area, just below the psychologically-important 200.00 figure. Prior to that, ETH/USD traded as high as 224.34 in late September and prior to that the market traded as high as 364.43 in June. One level related to these relative highs that traders are closely monitoring is the 135.90 area, representing the 23.6% retracement of the move from 199.50 to 116.25.
Now that the markets have moved above the 135.90 area, the 145.33 area will be closely watched. ETH/USD Bears and those who anticipate a weaker market are looking at important technical levels that include the 127.99, 127.14, 126.50, 125.75, 123.50, and 120.73 areas. A break below the 116.25 area opens up a possible test of the 104.77 area, the last major area of technical Support above the psychologically-important 100.00 figure. ETH/USD Bulls and those who anticipate a stronger market are looking at important technical levels that include the 144.77, and 146.59 areas. Some Stops are cited above the 148.05 level.
Price activity is nearest the 200-bar MA (4-hourly) at 135.78 and the 50-bar MA (Hourly) at 137.70.
Technical Support is expected around 132.90/ 126.04/ 119.50 with Stops expected below.
Technical Resistance is expected around 146.00/ 153.00/ 157.73 with Stops expected above.
On 4-Hourly chart, SlowK is Bearishly below SlowD while MACD is Bullishly above MACDAverage.
On 60-minute chart, SlowK is Bullishly above SlowD while MACD is Bearishly below MACDAverage.
Investment Disclaimer


