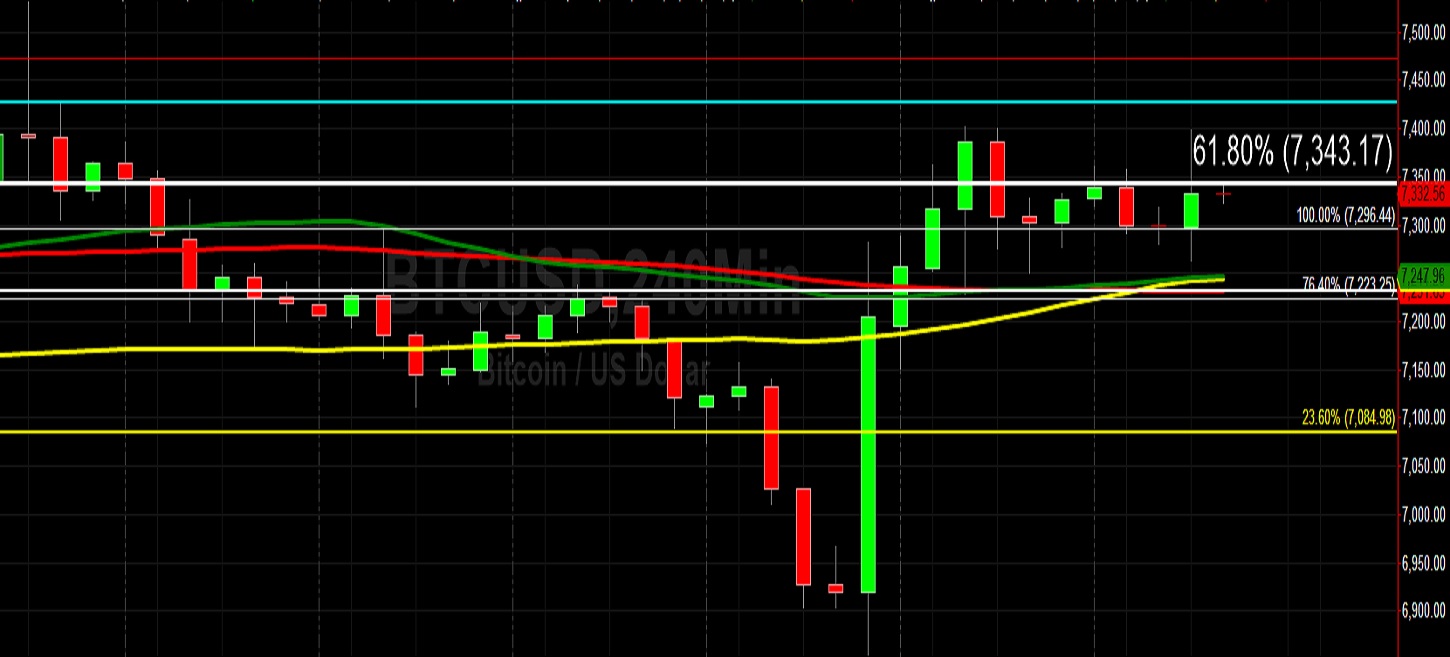
Bitcoin (BTC/USD) gained ground early in today’s Asian session as the pair climbed to the 7339.78 area after buying pressure emerged around the 7263.32 area during yesterday’s North American session. Earlier in yesterday’s North American session the pair traded as high as the 7398.00 area, just above the 7391.87 area that represents the 23.6% retracement of the move from 6430.00 to 7688.99. Prior to moving back above the 7000 figure, BTC/USD had started the new year off on the defensive, falling back below the psychologically-important 7000 figure on Thursday after Stops were elected below the 7084.98 area earlier in the day, a level that represents the 23.6% retracement of the 19891.99 – 3128.89 range. This was BTC/USD’s first print below the 7000 figure since 18 December.
Stops were also triggered below the 6910.93 area during the move lower, a level that represents the 61.8% retracement of the recent appreciation from 6430 to 7688.99. After that level was absorbed, traders again tested the 6899.15 area, a level that represents a downside price objective that became relevant on 10 November following the pair’s test of the 9150 area after the late-October recent relative high of 10540.49 was established. Downside price objectives now include the 6727.12 area and traders are also paying very close attention to the 6526 area, the recent relative low from 25 November prior to the pair’s 6430 print on 18 December. Above current price activity, upside price objectives include the 7537, 7806, and 7927 levels.
Price activity is nearest the 50-bar MA (4-hourly) at 7,248.04 and the 50-bar MA (Hourly) at 7,246.63.
Technical Support is expected around 6526.00/ 6323.42/ 5941.26 with Stops expected below.
Technical Resistance is expected around 7870.10/ 7927.23/ 8338.78 with Stops expected above.
On 4-Hourly chart, SlowK is Bullishly above SlowD while MACD is Bullishly above MACDAverage.
On 60-minute chart, SlowK is Bullishly above SlowD while MACD is Bearishly below MACDAverage.
Ethereum (ETH/USD) pared gains early in today’s Asian session as the pair settled back around the 133.53 area after trading as high as the 135.75 level during yesterday’s North American session. The pair has recently been orbiting the 132.89 level, representing the 50% retracement of the move from 302.20 to 80.60. Prior to moving back above the 130.00 figure, the pair had started the new year on the back foot, falling below the 129.60 and 127.05 areas that represent the 38.2% and 50% retracements of the recent price appreciation from 116.25 to 137.85. Likewise, the 126.04 area was an important price level that gave way and represents the 23.6% retracement of the recent depreciation from 157.73 to 116.25. There is now a heightened risk that ETH/USD may be able to push the pair lower to test the recent low of 116.25.
One important level to watch ahead of the 116.25 area includes the 125.16 area, representing the 61.8% retracement of the 100.15 – 165.62 range. Chartists anticipate some buying demand to emerge around the 120.61 – 121.76 range with some Stops anticipated below. Below the 116.25 area, traders are eyeing the 115.60 level that represents the 76.4% retracement of the aforementioned 100.15 – 165.62 range. Thereafter, the 114.42 level is technically significant and some traders anticipate some Stops below the 111.17 level.
Price activity is nearest the 200-bar MA (4-hourly) at 136.32 and the 50-bar MA (Hourly) at 131.76.
Technical Support is expected around 119.50/ 115.60/ 111.17 with Stops expected below.
Technical Resistance is expected around 137.61/ 141.74/ 146.00 with Stops expected above.
On 4-Hourly chart, SlowK is Bullishly above SlowD while MACD is Bullishly above MACDAverage.
On 60-minute chart, SlowK is Bearishly below SlowD while MACD is Bearishly below MACDAverage.