Published
4 years ago on
January 30, 2020
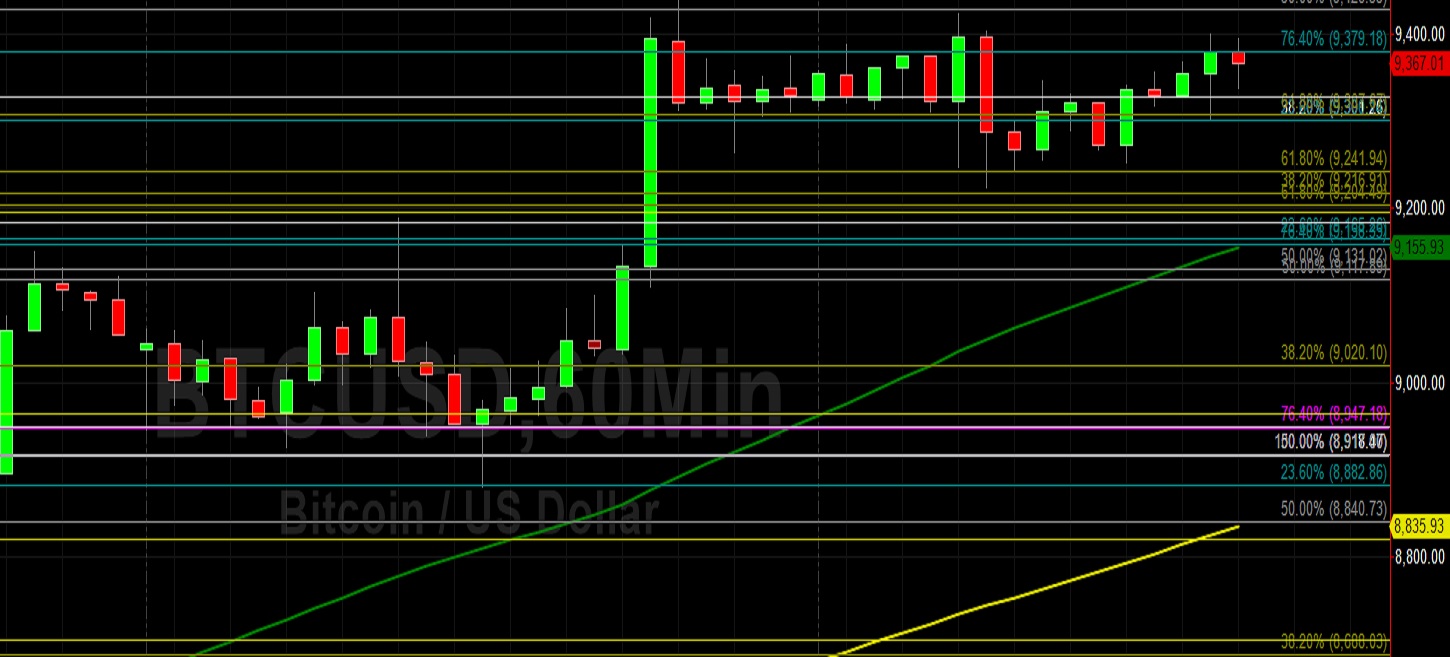
Bitcoin (BTC/USD) appreciated early in today’s Asian session as the pair gained ground to the 9399.89 area after finding technical support around the 9224.75 area during yesterday’s European session and trading as high as the 9439.83 area during yesterday’s Asian session. The pair’s resurgence this week has seen the pair get back above the 8447.58 and 8590.41 areas, representing the 23.6% and 38.2% retracements of the recent depreciation from 9194.99 to 8216.71. Thereafter, Stops were elected above the 8705.85 area, representing the 50% retracement of the same range. Given the pair’s recent climb, traders are evaluating BTC/USD’s trading activity within the context of some wider historical ranges. One of those ranges commenced in late June when the pair traded as high as the 13868.44 area. The 8185.47 area represents the 23.6% retracement of that range, and traders will be curious to see if this level can serve as technical support for the pair. Stops were also elected above the 9271.47 area, representing its 38.2% retracement, followed by the 10149.22 level.
Another wide range commenced in July when the pair traded as high as the 13202.63 area. The 8028.34 area represents the 23.6% retracement of this range, and the 9017.14 area represents the 38.2% retracement of this range followed by the 9816.32 and 10615.49 levels. Another very wide range is the move from 19891.99 to 3128.89, with the 7084.98 area representing the 23.6% retracement and the 9532.39 area representing the 38.2% retracement. Additionally, traders are also paying attention to the 3128.89 – 13868.44 appreciation, with the 8498.67 level representing the 50% retracement and the 9765.93 level representing the 38.2% retracement.
Price activity is nearest the 100-bar MA (4-hourly) at 8,670.90 and the 50-bar MA (Hourly) at 9,155.97.
Technical Support is expected around 8882.86/ 8535.67/ 8156.16 with Stops expected below.
Technical Resistance is expected around 9593.07/ 9679.83/ 9845.15 with Stops expected above.
On 4-Hourly chart, SlowK is Bearishly below SlowD while MACD is Bullishly above MACDAverage.
On 60-minute chart, SlowK is Bullishly above SlowD while MACD is Bearishly below MACDAverage.
Ethereum (ETH/USD) weakened early in today’s Asian session as the pair fell to the 175.22 area after trading as high as the 178.31 area during yesterday’s European session. The pair’s recent gains have seen it trade back above the 170.00 figure, up from the recent relative low around the 154.48 area and the 2020 low around the 125.52 area. This upside progress has also seen ETH/USD recently trade above the 166.90 and 169.83 areas, representing the 50% and 61.8% retracements of the 179.32 – 154.48 range. As a result, traders are now evaluating the pair’s progress within the context of some historical trading ranges. One such range involves the move from 199.50 to 116.25, and the 167.70 area represents the 61.8% retracement while the 179.85 area represents the 76.4% retracement.
Another important range relates to the depreciation from 239.35 to 116.25 where the 163.31 and 177.85 areas represent the 38.2% and 50% retracements. Another important level is the 174.83 area, which represents the 23.6% retracement of the move from 364.49 to 116.25. An additional important technical level is the 165.25 area, representing the 38.2% retracement of the move from 302.20 to 80.60. Traders will be interested to see if ETH/USD can derive technical support around some of these levels during pullbacks. Important levels above the market include the 179.85, 183.05, 190.94, 191.40, and 193.55 levels.
Price activity is nearest the 50-bar MA (4-hourly) at 166.36 and the 50-bar MA (Hourly) at 173.61.
Technical Support is expected around 164.02/ 156.47/ 154.48 with Stops expected below.
Technical Resistance is expected around 179.32/ 180.45/ 187.15 with Stops expected above.
On 4-Hourly chart, SlowK is Bearishly below SlowD while MACD is Bullishly above MACDAverage.
On 60-minute chart, SlowK is Bearishly below SlowD while MACD is Bearishly below MACDAverage.
Investment Disclaimer