Published
4 years ago on
January 26, 2020
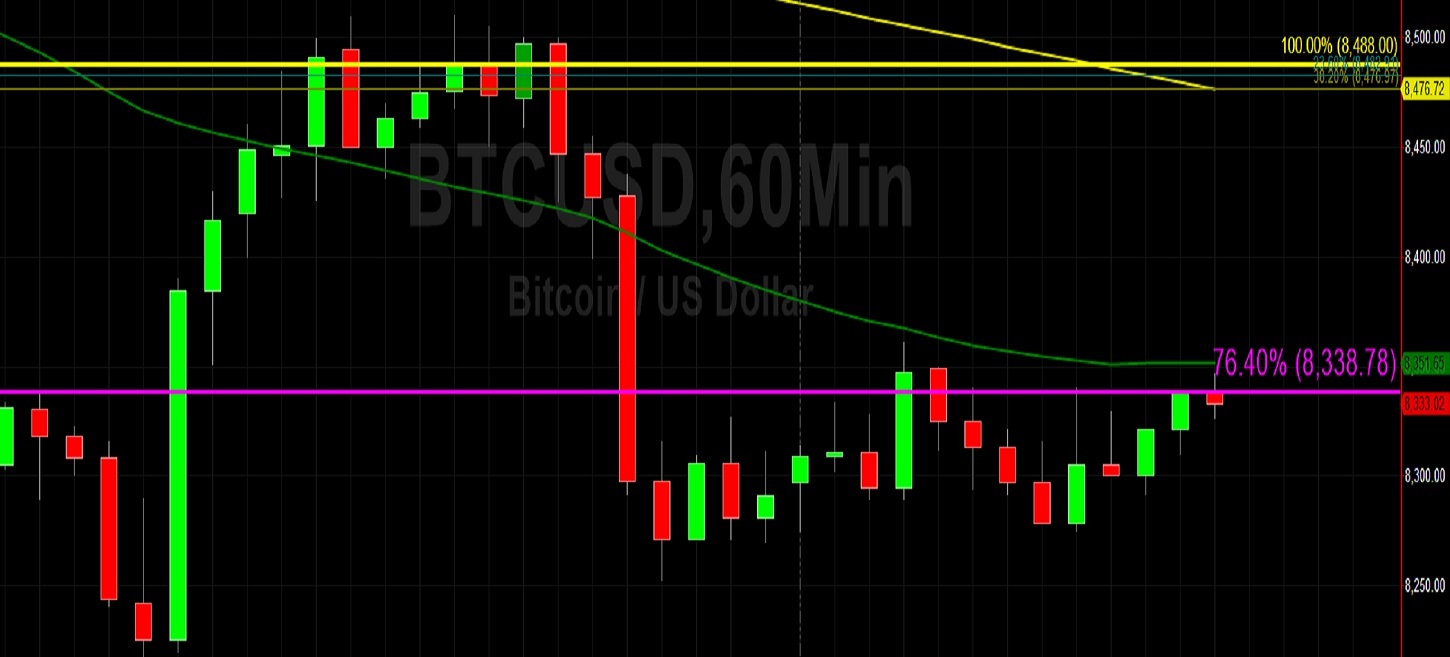
Bitcoin (BTC/USD) rallied slightly early in today’s Asian session as the pair pushed higher to the 8346.97 area after bids emerged around the 8252.73 area during yesterday’s Asian session. The pair’s recent move higher ran out of steam around the 8509.99 level, just below the 8522.91 area which is a technically-significant area related to the move higher from the 6430.00 area earlier this month. The next downside level of technical support in this particular range is the 7723.00 area and the next upside level of technical resistance in this particular range is the 9169.41 area. The technical significance of this 9169.41 area was established on 18 January after Stops were elected above this level, pushing the market to the 9194.99 area.
One recent range that some traders are carefully monitoring is the move from 8791.76 to 8216.71. The technical significance of this range was confirmed over the past couple of days when price activity traded just above the 8572.09 area three times, representing the 61.8% retracement of the range. The next upside price retracement level in this range is the 8656.05 area and the next downside retracement level in this range is the 8504.24 area. Traders cite Stops below the 8352 and 8311 areas. Below current market activity, traders cite buying pressure around the 8292 and 8223 levels and above current market activity, traders cite selling pressure around the 8923 and 9131 areas.
Price activity is nearest the 100-bar MA (4-hourly) at 8,464.25 and the 50-bar MA (Hourly) at 8,351.72.
Technical Support is expected around 8156.16/ 7662.03/ 7568.45 with Stops expected below.
Technical Resistance is expected around 9194.99/ 9303.07/ 9593.07 with Stops expected above.
On 4-Hourly chart, SlowK is Bullishly above SlowD while MACD is Bullishly above MACDAverage.
On 60-minute chart, SlowK is Bullishly above SlowD while MACD is Bullishly above MACDAverage.
Ethereum (ETH/USD) gained marginal ground early in today’s Asian session as the pair moved higher to the 161.03 area after finding technical support around the 157.40 area during yesterday’s Asian session. The pair’s recent run higher to the 164.21 area saw some Stops elected above the 162.77 area, representing the 50% retracement of the move from 171.05 to 154.48. The next upside price retracement level representing some potential technical resistance in this range is the 164.72 area, and the next downside price retracement level representing some potential technical support in this range is the 158.38 area. The short-term significance of this range was confirmed late last week when Stops were triggered below the 160.81 area, a level that represents the 38.2% retracement of the range.
Another important range that traders are monitoring is the move from 154.48 to 164.21. Stops were executed below the 161.91, 160.49, 159.95, and 158.20 areas during the pair’s descent late last week, levels that represent the 23.6%, 38.2%, 50%, and 61.8% retracements. The next downside level of potential technical support in that range is the 156.78 area. Below current market activity, traders cite buying pressure around the 157.88 and 154.71 levels and above current market activity, traders cite selling pressure around the 177.11 and 179.19 areas.
Price activity is nearest the 100-bar MA (4-hourly) at 158.19 and the 50-bar MA (Hourly) at 160.20.
Technical Support is expected around 156.47/ 153.07/ 147.83 with Stops expected below.
Technical Resistance is expected around 165.53/ 167.31/ 171.06 with Stops expected above.
On 4-Hourly chart, SlowK is Bullishly above SlowD while MACD is Bullishly above MACDAverage.
On 60-minute chart, SlowK is Bullishly above SlowD while MACD is Bullishly above MACDAverage.
Investment Disclaimer