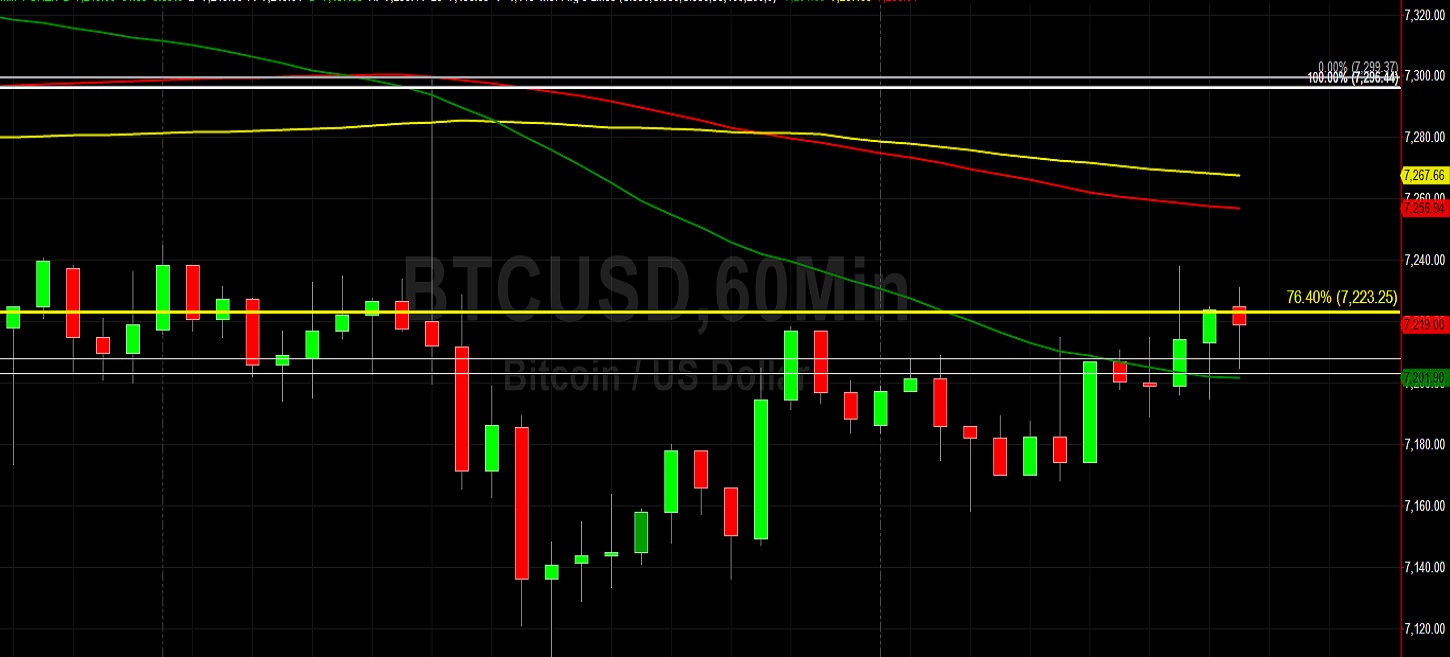
Bitcoin (BTC/USD) extended its gradual gains early in today’s Asian session as the pair climbed higher to the 7231.27 area after trading as low as the 7111.00 level during Tuesday’s North American session. Traders continue to exhibit a negative trading bias following the pair’s continued inability to sustain moves to the upside. A move to the 7531.00 area earlier in the week was very short-lived and resulted in the pair moving back below the 7250.00 level. Notably, that move higher stalled just below the 7538.97 area, representing the 76.4% retracement of the 7688.99 – 7053.32 level. Some BTC/USD bulls anticipated some near-term strength following a positive crossover of the 50-bar MA (4-hourly) above the 200-bar MA (4-hourly), but price activity quickly fell below these indicators and tested the 100-bar MA (4-hourly).
Some Stops were triggered below the 7203.34 area earlier this week, a level that represents the 23.6% retracement of the recent 7688.99 – 7053.32 range. Traders are eyeing some downside price objectives including the 7059.50 and 6910.93 area, representing the 50% and 61.8% retracements of the 6430.00 – 7688.99 range. Another important level represents the 6899.15 area, a downside price objective related to the late-October high of 10540.49. If that level is breached, the recent relative lows of 6526 and 6430 will be closely watched, followed by the 6038 area.
Price activity is nearest the 50-bar MA (4-hourly) at 7,256.92 and the 50-bar MA (Hourly) at 7,202.03.
Technical Support is expected around 6526.00/ 6323.42/ 5941.26 with Stops expected below.
Technical Resistance is expected around 7870.10/ 7927.23/ 8338.78 with Stops expected above.
On 4-Hourly chart, SlowK is Bullishly above SlowD while MACD is Bearishly below MACDAverage.
On 60-minute chart, SlowK is Bullishly above SlowD while MACD is Bullishly above MACDAverage.
Ethereum
Ethereum (ETH/USD) glided higher early in today’s Asian session as the pair appreciated to the 132.68 area after trading as low as the 127.60 level during Tuesday’s North American session. Market sentiment remains relatively weak, especially as price activity remains below important technical areas. One such level is the 135.90 area, representing the 23.6% retracement of the move from 199.50 to 116.25. Notably, the market has been unable to sustain three breaks above this area after trading as low as the 116.25 area in December. Similarly, the 132.90 level represents the 23.6% retracement of the 302.20 – 80.60 range.
A more recent trading range is the late-November high of 157.73 to the mid-December low of 116.25. Some important levels in that range include the 132.10, 136.99, and 141.88 levels, representing the 38.2%, 50%, and 61.8% retracements. The 129.60 area has provided some recent short-term technical support, and below that level the 127.05 and 124.50 levels may coincide with some additional buying demand. Traders are also monitoring the bullish convergence of the 50-bar MA (4-hourly) and 100-bar MA (4-hourly), and note that the 50-bar MA (hourly) has recently bullishly diverged from the 100-bar MA (hourly) and 200-bar MA (hourly).
Price activity is nearest the 100-bar MA (4-hourly) at 129.32 and the 100-bar MA (Hourly) at 130.75.
Technical Support is expected around 119.50/ 115.60/ 111.17 with Stops expected below.
Technical Resistance is expected around 137.61/ 141.74/ 146.00 with Stops expected above.
On 4-Hourly chart, SlowK is Bullishly above SlowD while MACD is Bearishly below MACDAverage.
On 60-minute chart, SlowK is Bullishly above SlowD while MACD is Bullishly above MACDAverage.