Published
4 years ago on
January 18, 2020
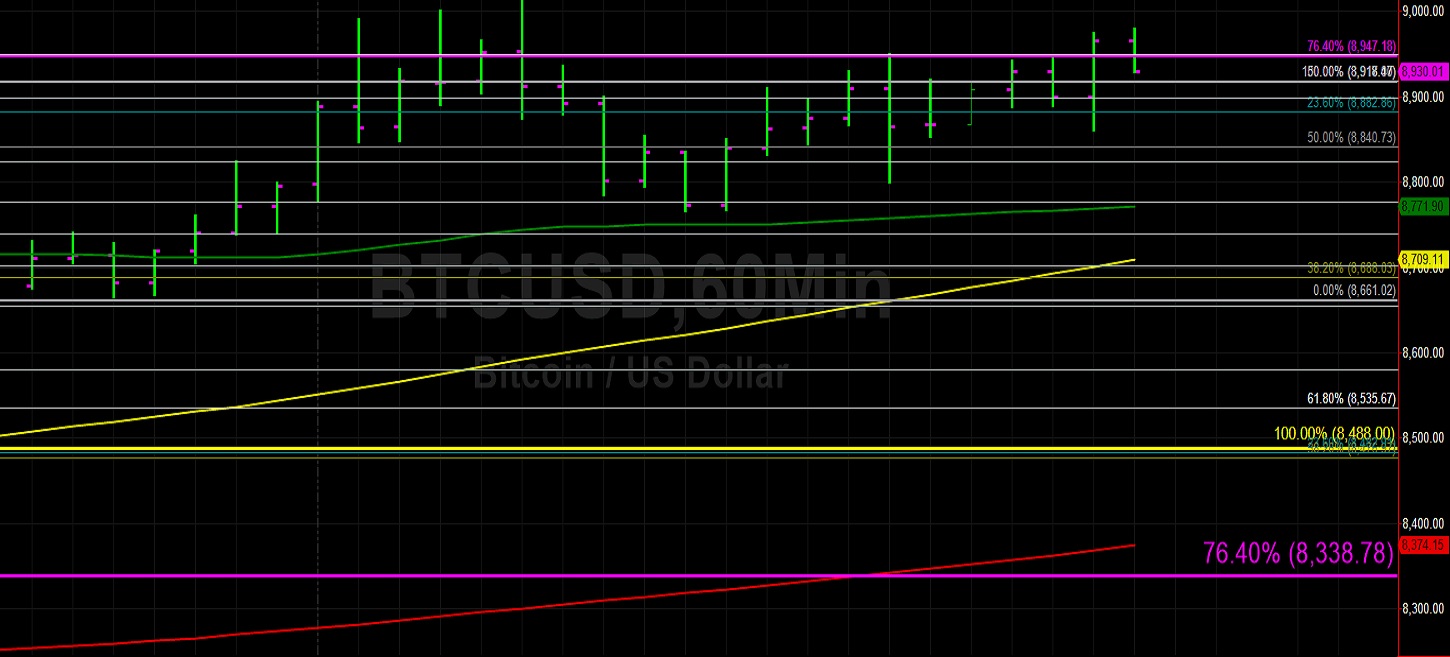
Bitcoin (BTC/USD) appreciated early in today’s Asian session as the pair climbed higher to the 8974.53 area after being supported around the 8766.27 level during yesterday’s North American session. After retesting the 8900 level mid-week, the pair has been largely rangebound and trading sideways, finding buying demand around the 8580 level. During the pair’s climb higher during yesterday’s Asian session, the pair reached the 8824.01 level, just above the 8823.72 area that represents the 76.4% retracement of the 8899.00 – 8580.00 range. The pair’s sideways trading has seen the 50-bar MA (hourly) catch up to price activity, reflecting a lack of a new directional bias. Even though price activity remains significantly above the 50-bar MA (4-hourly), traders await the pair’s next major move.
Following this upward movements in price activity earlier this week, traders are monitoring some technical support around levels including the 8417, 8118, 7877, and 7635 areas. These levels relate to the recent appreciation from the 6854.67 level and price activity around them will be closely watched. Upside price targets include the 9011, 9047, 9150, and 9259 levels and Stops are cited above the 9242 area. Below market activity, traders cite bids around the 8535, 8488, 8338, and 8156 levels. Stops are seen below the 8062 level.
Price activity is nearest the 50-bar MA (4-hourly) at 8,372.21 and the 50-bar MA (Hourly) at 8,772.74.
Technical Support is expected around 8338.78/ 7662.03/ 7568.45 with Stops expected below.
Technical Resistance is expected around 9006.95/ 9128.51/ 9593.07 with Stops expected above.
On 4-Hourly chart, SlowK is Bullishly above SlowD while MACD is Bullishly above MACDAverage.
On 60-minute chart, SlowK is Bullishly above SlowD while MACD is Bullishly above MACDAverage.
Ethereum (ETH/USD) moved higher early in today’s Asian session as the pair traded as high as the 173.47 area after being supported around the 164.93 level during yesterday’s North American session. The pair has steadily glided higher after testing buying demand around the 158.17 level during Thursday’s Asian session. The next upside level in the range is the 168.87 area and the next downside level in that range is the 165.18 area followed by the 163.52 and 161.48 levels. Some decent bids emerged just below the 165.25 level during yesterday’s North American session, a level that represents the 38.2% retracement of the 302.20 – 80.60 range.
Chartists continue to monitor price activity relative to major price levels including the 164.00, 163.11, and 170.30 areas that represent upside retracement areas related to the depreciation from the 318.60, 239.45, and 224.34 levels. The 163.43, 158.02, 153.65, 149.26, and 143.87 areas are technically-significant levels related to the recent appreciation from the 135.12 area to the 172.18 area. Likewise, the 157.73 area represents the 38.2% retracement of the move from 224.84 to 116.25. Following the pair’s recent strength, traders are now monitoring upside price objectives including the 174.20, 177.34, and 179.19 areas. Stops are cited above the 177.11 level.
Price activity is nearest the 50-bar MA (4-hourly) at 153.12 and the 50-bar MA (Hourly) at 165.70.
Technical Support is expected around 159.86/ 156.47/ 153.07 with Stops expected below.
Technical Resistance is expected around 175.04/ 180.45/ 187.15 with Stops expected above.
On 4-Hourly chart, SlowK is Bullishly above SlowD while MACD is Bullishly above MACDAverage.
On 60-minute chart, SlowK is Bullishly above SlowD while MACD is Bullishly above MACDAverage.
Investment Disclaimer