Published
4 years ago on
January 13, 2020
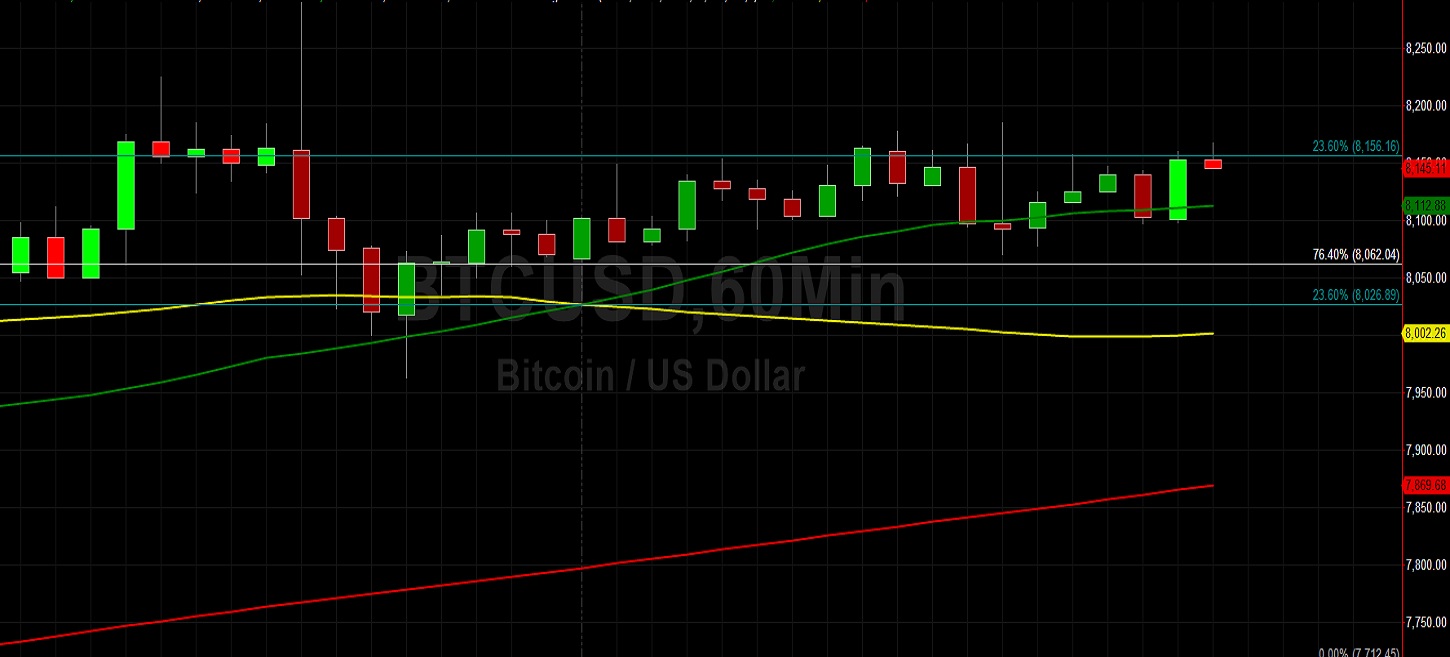
Bitcoin (BTC/USD) remained in a very tight range early in today’s Asian session as the pair was capped around the 8167.25 area, having traded in a rangebound manner during the past day. After trading as low as the 7963.25 area during yesterday’s Asian session, the pair’s range has been extremely limited.
More evidence of the technical trading activity emerged this weekend when BTC/USD bears commenced with selling pressure around the 8290.00 area, just above the 8280.97 area that represents the 76.4% retracement of the 8469.39 – 7671.00 range. Bears remained in control down to the 7963.25 area, just below the 7975.98 area that represents the 38.2% retracement of the aforementioned range. One measure of the pair’s strength is price activity relative to the 8338.78 area, representing the 76.4% retracement of the move from 9948.12 to 3128.89.
Additionally, the pair has been trading above the 50-bar MA (4-hourly) for several days, a bullish indication that BTC/USD bulls have been in charge during the short-term. Another important range that traders continue to monitor is the recent appreciation from the 8654.67 to 8469.39. One important level in this range is the 7662.03 area, representing the 50% retracement of that range, with the next downside levels at the 7471.49 and 7235.74 area. Below current price activity, traders anticipate Bids around the 7597, 7473, 7313, and 7117 areas. Above current price activity, traders anticipate Offers around the 8340, 8585, and 8799 areas.
Price activity is nearest the 50-bar MA (4-hourly) at 7,884.33 and the 100-bar MA (Hourly) at 8,113.12.
Technical Support is expected around 7662.03/ 7568.45/ 6526.00 with Stops expected below.
Technical Resistance is expected around 8587.90/ 8799.53/ 9006.95 with Stops expected above.
On 4-Hourly chart, SlowK is Bearishly below SlowD while MACD is Bearishly below MACDAverage.
On 60-minute chart, SlowK is Bullishly above SlowD while MACD is Bullishly above MACDAverage.
Ethereum (ETH/USD) showed a slight bid early in today’s Asian session as the pair traded as high as the 145.56 area but had not yet broken out of the tight sideways range that has confined price activity over the past day. After bids emerged around the 141.83 area during yesterday’s Asian session, there has been a lack of a market bias to the upside or downside. Selling pressure emerged this weekend around the 148.00 figure, just below a couple of key levels that are influencing price activity. First, the 148.12 area is an upside price objective related to the move higher from the 125.52 level that began on 2 January. Second, the 148.05 area is acting as technical resistance because it represents the 38.2% retracement of the 199.50 – 116.25 range.
The pair has also been recently trading above the 50-bar MA (4-hourly) and 50-bar MA (hourly), bullish price activity that reflects improved market sentiment. During a pullback this weekend, technical support emerged around the 141.83 area, above the 141.71 level that represents the 61.8% retracement of the 131.80 – 157.73 range. Likewise, that buying pressure emerged above another important area, namely the 141.56 level that represents the 50% retracement of the 148.00 – 135.12 range. The next downside levels of technical support in this range include the 140.04 and 138.16 levels. Below current price activity, traders will pay close attention to levels including the 134.14, 132.46, 130.00, and 128.15 areas. Above current market activity, traders will pay close attention to levels including the 148.12, 148.74, 151.17, and 151.61 areas.
Price activity is nearest the 50-bar MA (4-hourly) at 140.85 and the 100-bar MA (Hourly) at 144.04.
Technical Support is expected around 135.12/ 132.90/ 130.83 with Stops expected below.
Technical Resistance is expected around 148.74/ 153.00/ 157.73 with Stops expected above.
On 4-Hourly chart, SlowK is Bearishly below SlowD while MACD is Bullishly above MACDAverage.
On 60-minute chart, SlowK is Bullishly above SlowD while MACD is Bullishly above MACDAverage.
Investment Disclaimer