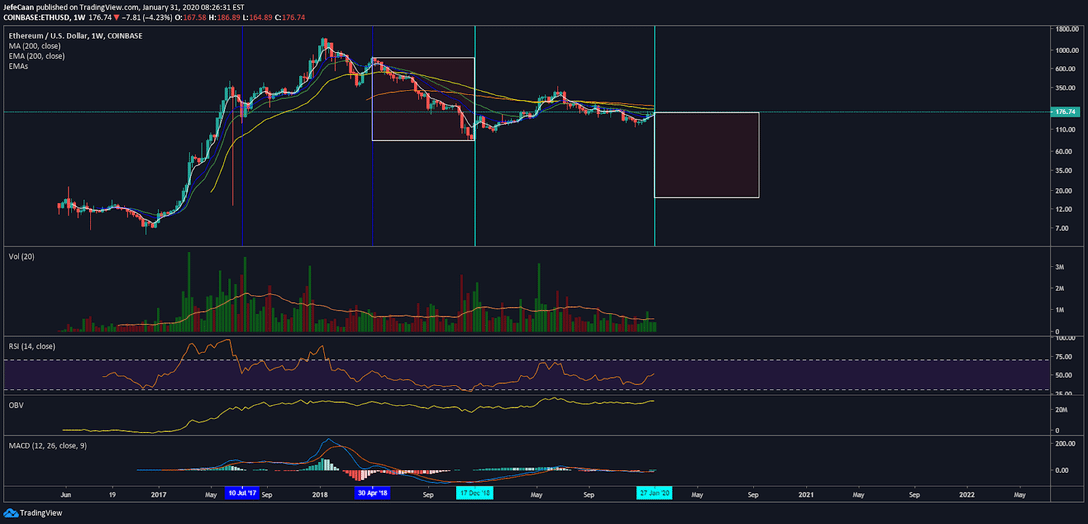
Ethereum (ETH) rallied again yesterday and stopped just shy of $190. This was a pretty aggressive move which has a lot of people thinking about the beginning of a new bullish cycle now just like they did in April, 2018. The weekly chart for ETH/USD shows that Ethereum (ETH) had just rallied after finding a temporary bottom back then which led many traders into thinking that a new bullish cycle may be just around the corner. However, that is not what happened and the price started to crash almost 90% from there. We are now at a similar point where the price has just rallied from a temporary bottom and everyone is talking about the beginning of a new bullish cycle.

If we do not see a new bullish cycle, we might be looking at a new bear trend that could pull the price of Ethereum (ETH) down to double digits. Previously, I have mentioned targets of $60 and $50 but this time I want to talk about a number that is important to keep in mind and that is $14. That is when Ethereum (ETH) began the 2017 rally and shot up astronomically to its all-time high. Now that Bitcoin dominance (BTC.D) is eyeing a reversion to pre 2017 levels, we expect a similar reversion in the rest of the market and therefore ETH/USD might end up falling a lot lower than I previously expected. This would be the way the bubble truly pops because I don’t think the bubble has popped just yet. It will most likely coincide with a similar move in the S&P 500 (SPX) and a gloomy outlook of global financial markets.
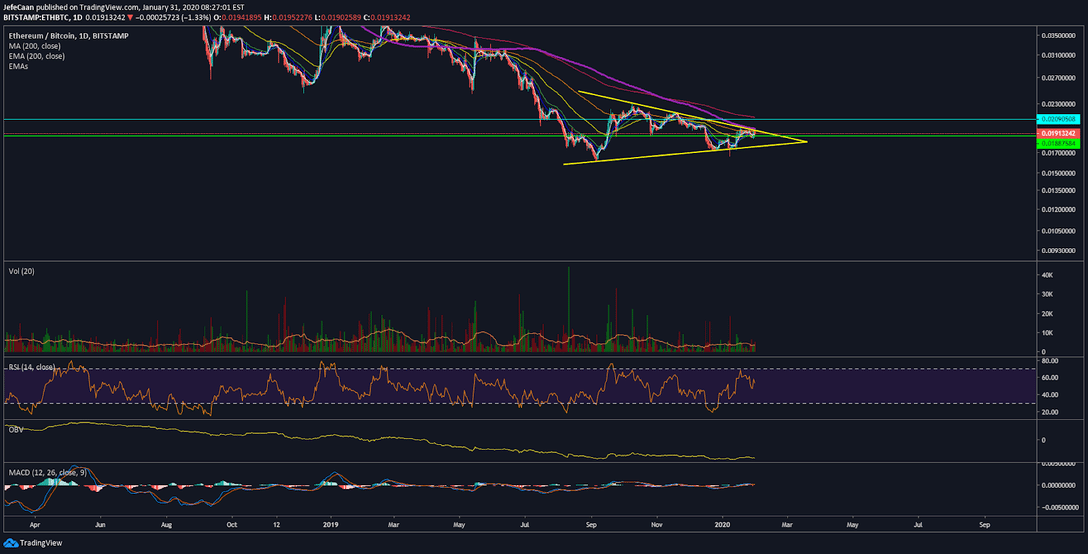
Ethereum (ETH) also risks losing significant ground against Bitcoin (BTC). It has already given up most of its gains against Bitcoin (BTC) but it is far from over just yet. If and when the next downtrend begins, we would expect ETH/BTC to decline much lower. It already remains below the 200-day moving average and is primed for further downside once we have a clear break below the symmetrical triangle that it is currently trading in.
This would be a period where we could see the altcoin market experience serious pain. The daily chart for ETH/BTC also shows that Ethereum (ETH) has struggled but failed to break above the symmetrical triangle as well as the 200-day moving average. As Bitcoin halving nears, even under the bullish case investors would be more inclined to get out of altcoins and FOMO into Bitcoin (BTC). This alone would be devastating for Ethereum (ETH) as well as the rest of the market and would be one of the key catalysts leading to the bubble being popped.