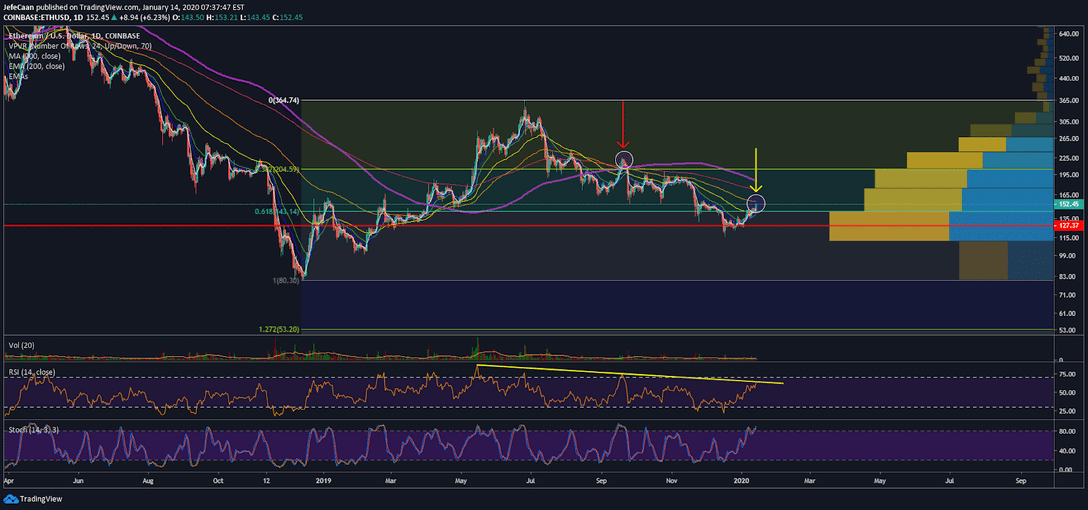
It is interesting how so many retail traders look at breakouts in such a simple way. They also conveniently choose to ignore how certain things have happened in the past and what they have led to. For instance, let us look at Fibonacci retests in the past. We can see on the daily chart for ETH/USD that the price tested the 200-day moving average and the 38.2% fib level around $204.59 in September of last year. We can also see how the price shot up past both the 38.2% and the 200 Day MA and even closed above those levels.
However, you can see clearly how that was a fake move. The price ended up breaking below both of those levels soon after resulting a major downtrend. Now that the price has broken past the 61.8% fib level at $143.14 many traders are overly bullish once again without realizing that the same thing might very well happen once again. This time, we could see a close above the 50-day exponential moving average as well as the 61.8% fib level before the major downtrend kicks in. We can see on the RSI that a downtrend is in the making as it has just run into a key trend line resistance. This is absolutely not a time to be greedy. It would not surprise me even if the price pumps further to test the 200-day moving average once again.
So, what would it take to change my mind? It’s simple: invalidation of the current downtrend. There is still a well-established pattern of lower highs and lower lows. If ETH/USD makes a higher high and higher low and rises past the 38.2% fib level at $204.59, I will change my mind. However, until that happens, this an opportunity to remain bearish because the market is much more probable to decline way lower than it is to rise higher from current levels.
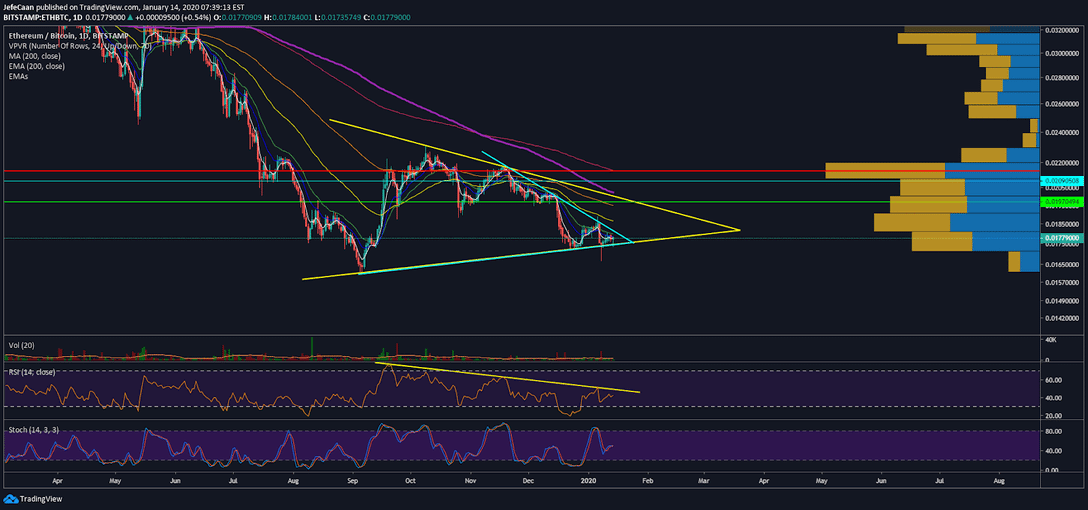
At the end of the day it all comes down to probabilities and as traders that is what we are interested in. The daily chart for ETH/BTC shows that Ethereum (ETH) is now at risking of breaking below a key symmetrical triangle against Bitcoin (BTC). The reason I say below is because we can see a clear downtrend on the RSI for ETH/BTC. Until and unless that is broken, there is no reason for me to be thinking about bullish breakouts. Even if the pair breaks to the upside I would still want to wait and see if we actually get an uptrend. Timing is everything. Missing a few percent move here and there is inconsequential in the grand scheme of things; it is much more important to wait for confirmation.